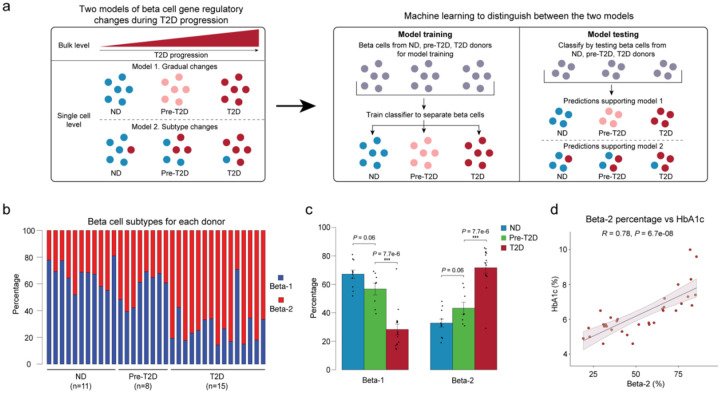
Figure 2. Machine learning identifies two beta cell subtypes with differential abundance in T2D.
(a) Schematic outlining the machine learning-based approach to distinguish two models that could account for gene regulatory changes in beta cells in T2D. (b) Relative abundance of beta-1 and beta-2 cells identified by machine learning. Each column represents cells from one donor. (c) Relative abundance of each beta cell subtype in ND, pre-T2D and T2D donor islets. Data are shown as mean ± S.E.M. (n = 11 ND, n = 8 pre-T2D, n = 15 T2D donors), dots denote data points from individual donors. ***P < .001; ANOVA test with age, sex, BMI, and islet index as covariates. (d) Pearson correlation between relative abundance of beta-2 cells and HbA1c across donors (n = 11 ND, n = 8 pre-T2D, n = 15 T2D donors).

