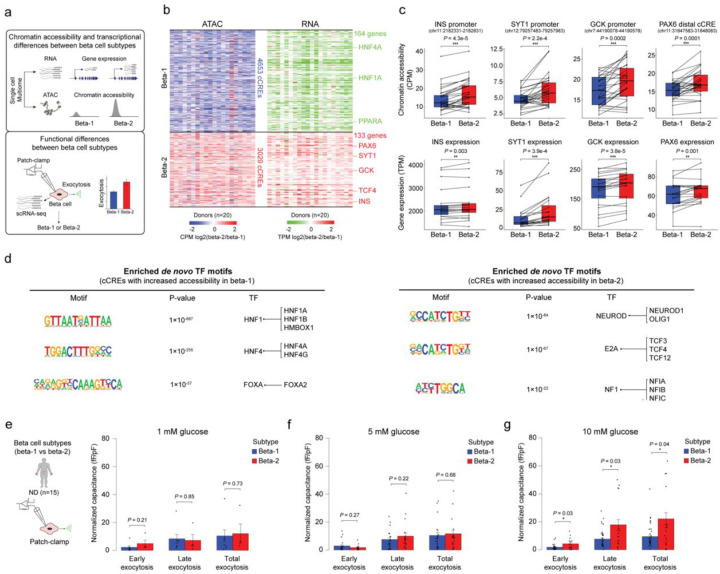
Figure 3. The two beta cell subtypes are distinguished by chromatin activity, gene expression and function.
(a) Workflow to link beta cell subtype chromatin activity to gene expression using islet single nucleus multiome (ATAC+RNA) data and gene expression to function using Patch-seq. (b) Heatmap showing log2 differences (beta-2/beta-1) in chromatin accessibility at cCREs with differential accessibility between beta cell subtypes (left, paired t-test, FDR < 0.05, P-values adjusted with the Benjamini-Hochberg method) and log2 differences (beta-2/beta-1) in gene expression of cCRE target genes with differential expression between beta cell subtypes (right, paired t-test, FDR < 0.15, P-values adjusted with the Benjamini-Hochberg method). Rows represent differential cCREs or genes, columns represent donors (total 20, ND, n=6; pre-T2D, n=8; T2D, n=6). Representative genes are highlighted. Accessibility of cCREs is normalized by CPM (counts per million) and gene expression by TPM (transcripts per million). (c) Bar plots showing cCRE accessibility (top) and gene expression (bottom) of representative genes in beta-1 and beta-2 cells. Proximal region of INS (chr11:2182331-2182831), SYT1 (chr12:79257483-79257983), GCK (chr7:44190078-44190578), PAX6 (chr11:31847583-31848083). Accessibility of peaks is normalized by CPM and gene expression by TPM. Paired t-test. (d) Transcription factor (TF) motif enrichment at cCREs with higher accessibility in beta-1 compared to beta-2 cells (left) or higher accessibility in beta-2 compared to beta-1 cells (right) against a background of all cCREs in beta cells using HOMER. The top three enriched de novo motifs, their P-values, and best matched known TF motif are shown. (e) Bar plots from Patch-seq analysis showing early, late and total exocytosis in beta-1 (10 cells from 4 ND donors) and beta-2 cells (4 cells from 4 ND donors) stimulated with 1 mM glucose. Data are shown as mean ± S.E.M., dots denote data points from individual cells. ANOVA test with age, sex, and BMI as covariates. (f) Bar plots from Patch-seq analysis showing early, late and total exocytosis in beta-1 (26 cells from 10 ND donors) and beta-2 cells (20 cells from 9 ND donors) stimulated with 5 mM glucose. ANOVA test with age, sex, and BMI as covariates. (g) Bar plots from Patch-seq analysis showing early, late and total exocytosis in beta-1 (42 cells from 5 ND donors) and beta-2 cells (23 cells from 6 ND donors) stimulated with 10 mM glucose. *P < .05, ANOVA test with age, sex, and BMI as covariates.

