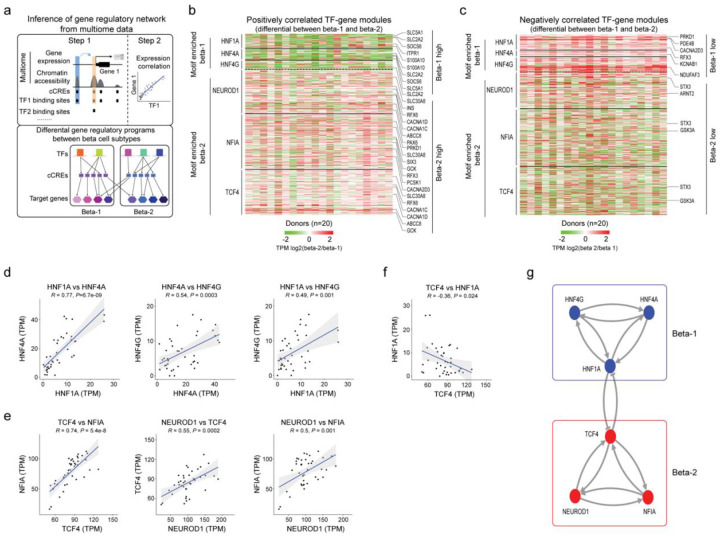
Figure 4. Gene regulatory networks defining the two beta cell subtypes.
(a) Schematic outlining the inference of beta cell gene regulatory networks and differential gene regulatory programs (TF-gene modules) between beta cell subtypes. (b) Heatmap showing log2 differences (beta-2/beta-1) in expression for genes positively regulated by TFs (HNF1A, HNF4A, HNF4G) with higher activity in beta-1 compared to beta-2 cells and TFs (NEUROD1, NFIA and TCF4) with higher activity in beta-2 compared to beta-1 cells (see Methods). Representative target genes of individual TFs are highlighted. Gene expression is normalized by TPM (transcripts per million). (c) Heatmap showing log2 differences (beta-2/beta-1) in expression for genes negatively regulated by TFs (HNF1A, HNF4A, HNF4G) with higher activity in beta-1 compared to beta-2 cells and TFs (NEUROD1, NFIA, TCF4) with higher activity in beta-2 compared to beta-1 cells (see Methods). Representative target genes of individual TFs are highlighted. Gene expression is normalized by TPM (transcripts per million). (d, e, f) Pearson correlation of expression levels between indicated TFs across pseudo-bulk RNA profiles from each beta cell subtype (40 dots in total: 20 donors including n = 6 ND, n = 8 pre-T2D, n = 6 T2D). (g) A bistable circuit established by positive feedback between HNF1A, HNF4A and HNF4G, positive feedback between NEUROD1, NFIA and TCF4, and mutual repression between HNF1A and TCF4.

