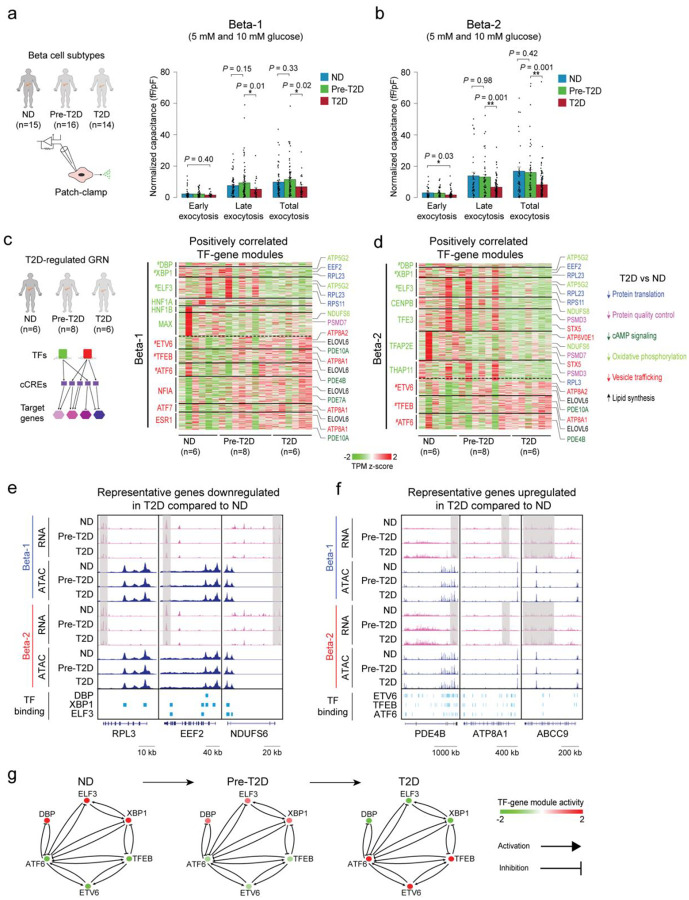
Figure 5. Beta cell functional and gene regulatory changes in T2D.
(a) Bar plots from Patch-seq analysis showing early, late and total exocytosis in beta-1 cells from ND (68 cells from 11 donors), pre-T2D (91 cells from 14 donors) and T2D donors (35 cells from 7 donors) stimulated with 5 mM or 10 mM glucose. Data are shown as mean ± S.E.M., dots denote data points from individual cells. *P < .05, ANOVA test with age, sex, and BMI as covariates. (b) Bar plots from Patch-seq analysis showing early, late and total exocytosis in beta-2 cells from ND (43 cells from 10 donors), pre-T2D (57 cells from 14 donors) and T2D donors (131 cells from 14 donors) stimulated with 5 mM or 10 mM glucose. *P < .05, **P < .01, ANOVA test with age, sex, and BMI as covariates. (c) Heatmap showing expression of genes positively regulated by TFs (green) with higher activity in ND compared to T2D beta-1 cells (see Methods) and TFs (red) with lower activity in ND compared to T2D beta-1 cells (n=6 ND, n=8 pre-T2D, n=6 T2D donors). Representative target genes of individual TFs are highlighted and classified by biological processes. Gene expression is normalized by TPM (transcripts per million). # denotes TFs with decreased or increased expression in T2D in both beta-1 and beta-2 cells. (d) Heatmap showing expression of genes positively regulated by TFs (green) with higher activity in ND compared to T2D beta-2 cells (see Methods) and TFs (red) with lower activity in ND compared to T2D beta-2 cells (n=6 ND, n=8 pre-T2D, n=6 T2D donors). Representative target genes of individual TFs are highlighted and classified by biological processes. Gene expression is normalized by TPM (transcripts per million). # denotes TFs with decreased or increased expression in T2D in both beta-1 and beta-2 cells. (e) Genome browser tracks showing aggregate RNA and ATAC read density at representative genes (RPL3, EEF2, NDUFS6) downregulated in T2D relative to ND for both beta-1 and beta-2 cells. Downregulated regions in T2D beta cells are indicated by grey shaded boxes. Beta cell cCREs with binding sites for downregulated TFs in both beta-1 and beta-2 cells (DBP, XBP1, ELF3) are shown. All tracks are scaled to uniform 1×10⁶ read depth. (f) Genome browser tracks showing aggregate RNA and ATAC read density at representative genes (PDE4B, ATP8A1, ABCC9) upregulated in T2D relative to ND for both beta-1 and beta-2 cells. Upregulated regions in T2D beta cells are indicated by grey shaded boxes. Beta cell cCREs with binding sites for upregulated TFs in both beta-1 and beta-2 cells (ETV6, TFEB, ATF6) are shown. All tracks are scaled to uniform 1×10⁶ read depth. (g) Cross regulation between TFs with activity change in T2D in both beta cell subtypes (from Figure 5c,d). The color code for TFs in ND, pre-T2D and T2D donors reflects their expression change during T2D progression.

