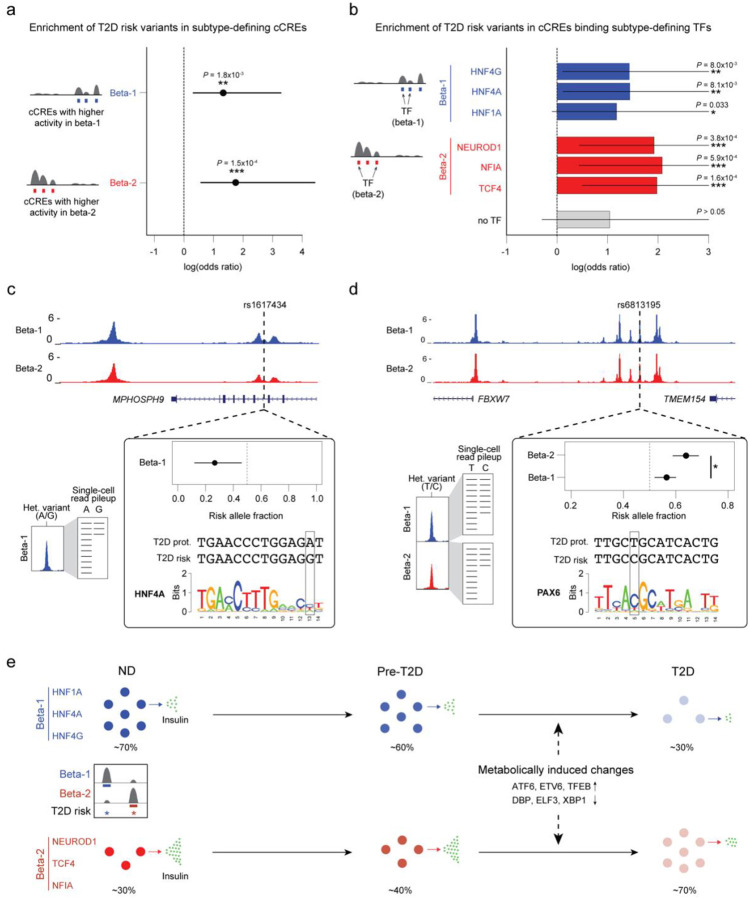
Figure 6. T2D risk variants affect beta cell subtype chromatin activity.
(a) Enrichment of fine-mapped T2D risk variants for cCREs defining the beta-1 and beta-2 subtype. Values represent log odds ratios and 95% confidence intervals. (b) Enrichment of fine-mapped T2D risk variants for cCREs defining the beta-1 and beta-2 subtype bound by each TF, or not bound by any of the listed TFs (‘no TF’). Values represent log odds ratios and 95% confidence intervals. (c) Fine-mapped T2D risk variant rs1617434 at the MPHOSPH9 locus overlaps a cCRE defining the beta-1 subtype. The T2D risk allele of this variant decreases beta-1 chromatin accessibility and disrupts a predicted binding site for HNF4A. The values for allelic imbalance represent the fraction of reads from the risk allele and the 95% confidence interval. On the left is a schematic describing allelic imbalance mapping in reads from the beta-1 subtype. (d) Fine-mapped T2D risk variant rs6813185 at the TMEM154/FBXW7 locus overlaps a cCRE active in both the beta-1 and beta-2 subtype. This variant has significant heterogeneity in allelic imbalance in beta-2 and beta-2 chromatin accessibility, where the T2D risk allele has larger effect in beta-2 compared to beta-1. The values for allelic imbalance represent the fraction of reads from the risk allele and the 95% confidence interval. On the left is a schematic describing allelic imbalance mapping in reads from the beta-1 and beta-2 subtype. * P<.05. (e) Schematic showing abundance and functional changes of beta cell subtypes during T2D progression. The TFs maintaining beta cell subtype identity as well as TFs mediating T2D-associated changes are shown.

