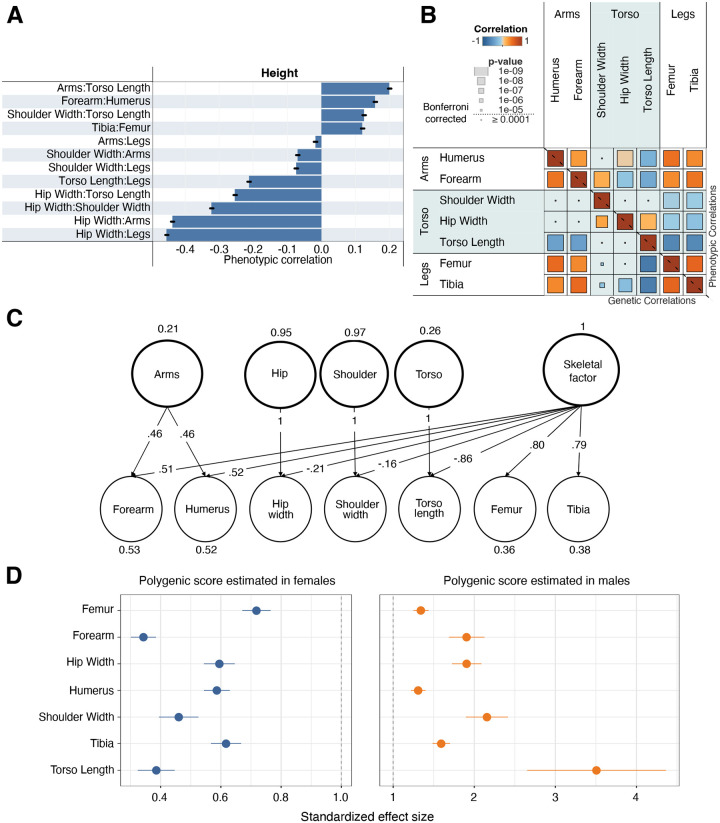
Fig. 2. Genetic architecture.
(A) Correlation of skeletal proportions and overall height. Bars show ±2 SE. (B) Genotype (lower-left triangle) and phenotype (upper-right triangle) correlation of skeletal proportions. Overall correlation is shown in color and the p-value of the correlation is visualized by size. A Bonferroni-corrected threshold is also shown. (C) Solution for a genomic SEM model for the genetic covariance structure shown in B shows one common factor loading for arms, an additional factor for legs, and finally independent factors for each of the torso-related traits (hip width, shoulder width, and torso length). (D) Sex-specific analysis showing the ratio of the standardized effect size of the polygenic score on each trait (±2 SE) in males to the effect in females in a hold-out dataset.

