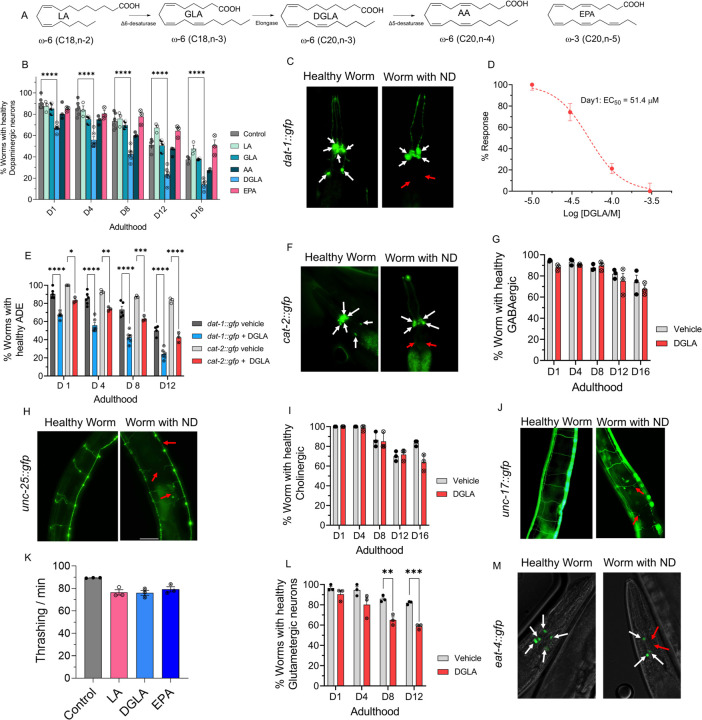
Figure 1. DGLA, but not other ω-3 and ω-6 PUFAs, induces degeneration, specifically in dopaminergic neurons.
(A) Structure of different ω-6 and ω-3 PUFAs examined in this study; (B) Percentage (%) of worms with healthy dopaminergic neurons for Pdat-1::gfp with and without supplementation with 100 μM of different ω-6 and ω-3 PUFAs. (C) Fluorescent images of Pdat-1::gfp worms with healthy and degenerated dopaminergic neurons (White arrows represent healthy neurons, and red arrows show degenerated/disappeared neurons); (D) Dose response curve: the effect of different DGLA concentrations on degeneration of ADE neurons on Day 1 adulthood; (E) Comparing the ADE neurons degeneration in Pdat-1::gfp and Pcat-2::gfp supplemented with 100 μM DGLA; (F) Fluorescent images of Pcat-2::gfp worms with healthy and degenerated dopaminergic neurons (White arrows represents healthy neurons, and red arrow shows degeneration/disappearance neurons); (G) Percentage (%) of worms with healthy GABAergic neurons for Punc-25::gfp with and without supplementation with 100 μM DGLA; (H) Fluorescence images of Punc-25::gfp worm with healthy and degenerated GABAergic neurons (Red arrows show different signs of neurodegeneration including ventral cord break, commissure break and branches); (I) Percentage (%) of worms with healthy cholinergic neurons for Punc-17::gfp with and without supplementation with 100 μM DGLA; (J) Fluorescence Images of Punc-17::gfp worms with healthy and degenerated cholinergic neurons (Red arrows show different signs of neurodegeneration including ventral cord break, commissure break and branches); (K)Thrashing on Day 8 adulthood of wild-type raised on 100 μM of LA, DGLA, and EPA; (L) Percentage (%) of worms with healthy glutamatergic neurons with Peat-4::gfp with and without supplementation with 100 μM DGLA; (M) Fluorescent images of Peat-4::gfp worms with healthy and degenerated glutamatergic neurons (White arrows represent healthy neurons, and red arrows show degenerated/disappeared neurons). All supplementations were done at the L4 stage. For all experiments N=3, and about 20 worms were tested on each trial. Two-way analysis of variance (ANOVA), Tukey’s multiple comparison test for (B) and (D); and t test for K: *P ≤ 0.05, **P ≤ 0.01, ***P ≤ 0.001, ****P < 0.0001, non-significant is not shown.

