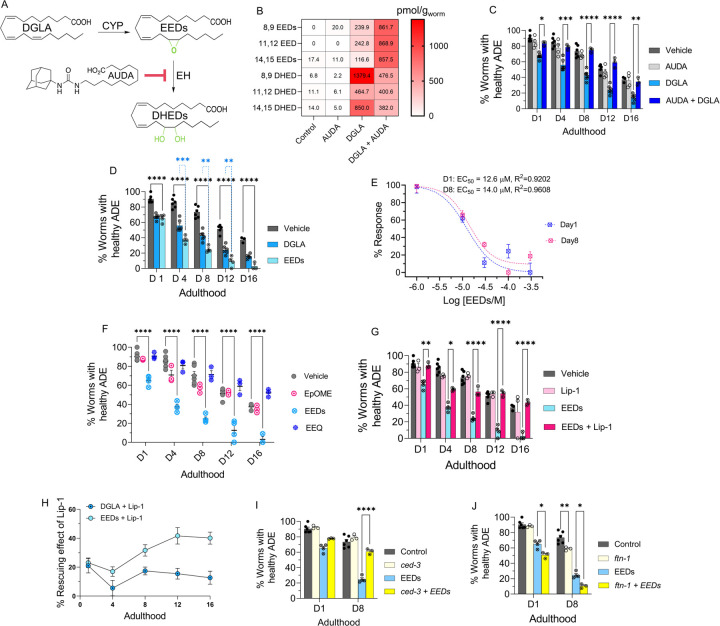
Figure 3. EED, epoxy metabolites downstream of DGLA, induce neurodegeneration by ferroptosis.
(A) DGLA is metabolized to EED and DHED through the CYP and epoxide hydrolase enzymes, respectively; and AUDA inhibits epoxide hydrolase; (B) Oxylipin profile representing the pmol/g of EED and DHED regioisomers in worms treated with 100 μM of DGLA ± 100 μM AUDA compared to control (C) Percentage (%) of worms with healthy ADE neurons for Pdat-1::gfp treated with 100 μM of DGLA ± 100 μM AUDA; (D) Percentage (%) of worms with healthy ADE neurons for Pdat-1::gfp worms treated with 100 μM DGLA and 100 μM EED; (E) Dose response curve: the effect of different concentration of EED on degeneration of ADE neurons on Day 1 and Day 8 adulthood; (F) Percentage (%) of worms with healthy ADE neurons in Pdat-1::gfp worms treated with 100 μM of different Ep-PUFAs, EpOME, and EEQ; (G) Percentage (%) of worms with healthy ADE neurons of worms treated with 100 μM DGLA ± 100 μM Liproxstatin-1;(H) Comparison the effect of 250 μM Liproxstatin-1 on Pdat-1::gfp worms treated with 100 μM of DGLA compared to 100 μM EED;(I) Percentage (%) of worms with healthy ADE neurons with Pdat-1::gfp and Pdat-1::gfp;ced-3 worms treated with 100 μM; (J) Percentage (%) of worms with healthy ADE neurons for Pdat-1::gfp and Pdat-1::gfp; ftn-1 worms treated with 100 μM DGLA; All supplementations were done at the L4 stage. Two-way analysis of variance (ANOVA), Tukey’s multiple comparison test. *P ≤ 0.05, **P ≤ 0.01, ***P ≤ 0.001, ****P < 0.0001, without * not significant. DGLA: Dihomo-γ-linolenic acid, EED: epoxyeicosadienoic acids, DHED: dihydroxyeicosadienoic acids, CYP: Cytochrome P450, EH: epoxide hydrolase, AUDA: 12-(1-adamantane-1-yl-ureido-) dodecanoic acid, Lip-1: Liproxstatin-1, EpOME: epoxyoctadecenoic acids; EEQ: epoxyeicosatetraenoic acid.

