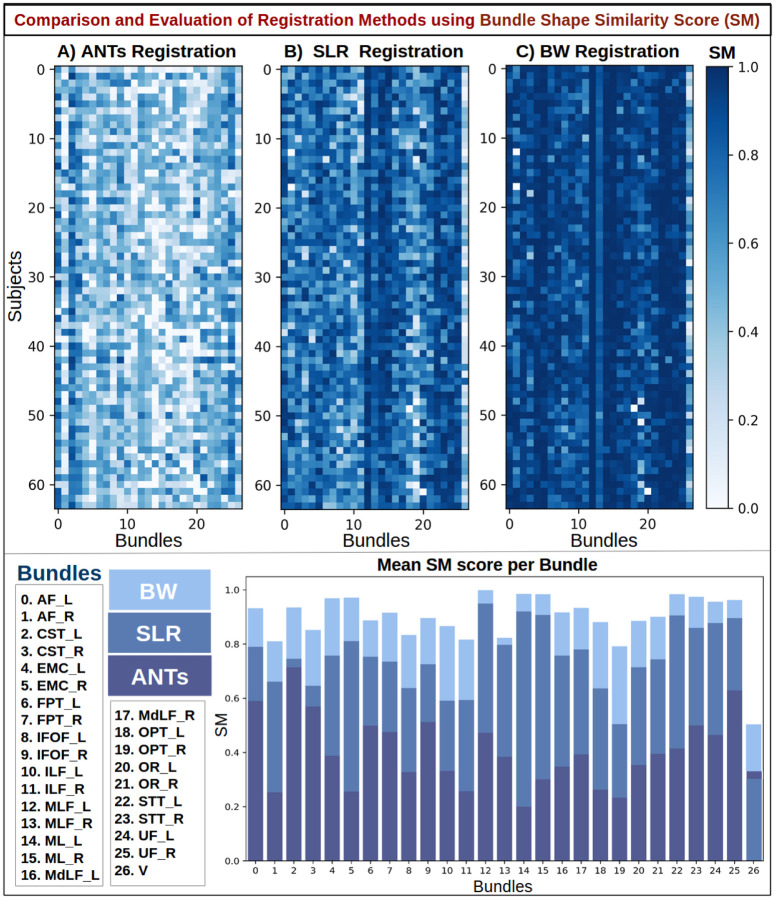
Figure 9.
Quantitative results using bundle shape similarity metric (SM) to compare Ants, SLR, and BundleWarp (BW) methods. The top panel shows three SM matrices for three registration methods. 27 bundles extracted from 64 subjects (1,728 total bundles) were registered to 27 atlas bundles of the same type. Here, rows represent subject and columns represent bundle type. Each pixel in the matrices indicates the SM score among the atlas bundle and registered bundle (static and moved). Darker blue means higher shape similarity, hence better registration performance. The bottom panel shows the mean SM score per bundle for each method and bundle names. BW method has the highest SM score for all bundles.

