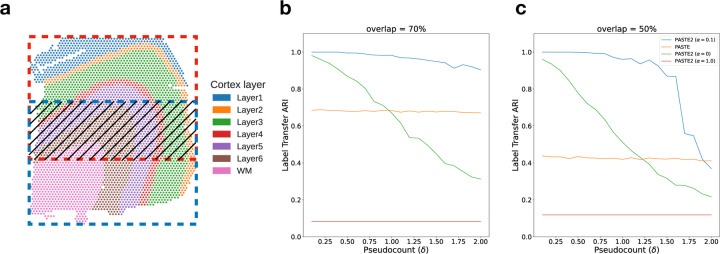
Figure 2: Comparison of PASTE2 and PASTE on simulated partially overlapping subslices.
a, DLPFC slice 151674 with spots colored according to the manual annotations of cortical layers from [32]. Red box and blue box indicate two partially overlapping subslices, with central overlapping region containing some fraction of spots from each slice. b, Label Transfer ARI of the alignments produced by PASTE2 with α = 0 (gene expression information only), PASTE2 α = 1 (spatial information only), PASTE2 α = 0.1 (both), and PASTE (full alignment, α = 0.1) as a function of the pseudocount (δ) for overlap percentage70%. c, Label Transfer ARI for overlap percentage 50%.

