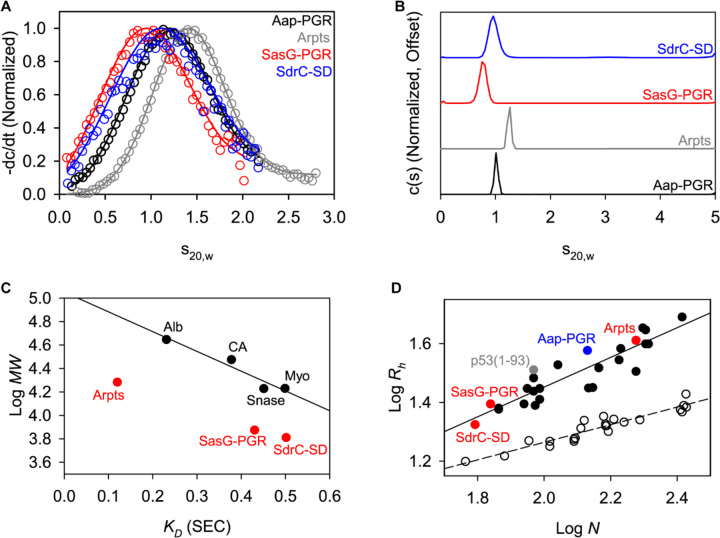
Figure 3. AUC and SEC indicate each construct is highly elongated and monomeric.
A) Time-derivative distributions from sedimentation velocity data. Empty markers indicate data, with every 8th data point shown for clarity. Solid lines represent the fit to a single-species model. B) Sedimentation velocity AUC data suggest each construct is monomeric and highly elongated, as indicated by the fitted parameters listed in Table 3. C) Linear relationship between SEC-measured KD and logMW for the folded protein standards (Alb, albumin; CA, carbonic anhydrase; Myo, myoglobin; Snase, staphylococcal nuclease), showing that the IDP constructs all deviate from the trend. Aap-PGR is omitted from this plot, as it was previously analyzed using different column resin. D) Linear relationship between log N (number of residues) and logRh in A. Folded proteins [1, 2] (open circles, dashed linear regression) and IDPs [5] (filled circles, solid linear regression) show distinct trends. SasG-PGR, Aap-Arpts, and SdrC-SD follow the trend with other IDPs, as previously observed for Aap-PGR [6].

