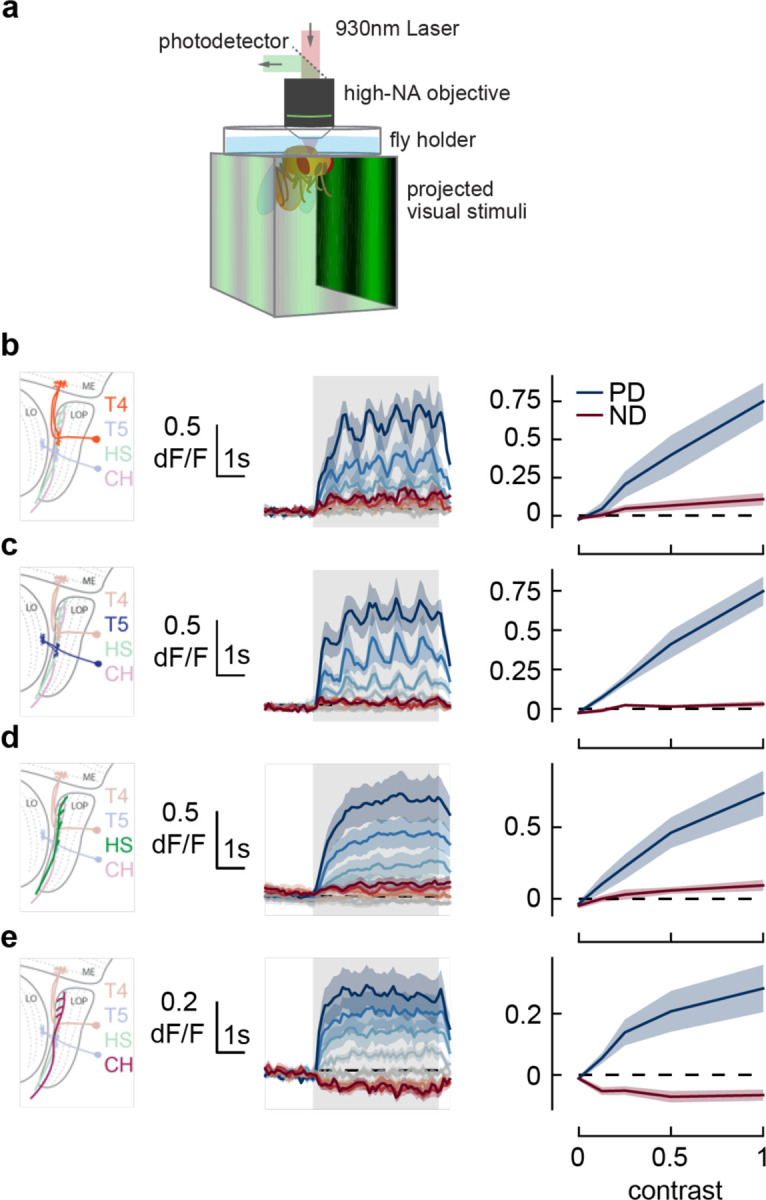
Figure 5. Responses in early direction-selective cells do not show a reduction or reversal of response on the timescale of the behavior.

a) We used two-photon microscopy to measure calcium activity in lobula plate neurons while presenting sinusoidal gratings at a range of contrasts.
b) T4 cells, marked in orange (left), responded to drifting sinusoidal gratings with increased calcium activity (middle). Darker colors indicate higher contrast, preferred direction in blue, null direction in red. When integrated across the stimulus presentation (right), calcium activity increased with stimulus contrast. N = 8 flies.
c-e) As in b) measuring calcium activity in T5, HS, and CH cells. N = 8, 10, 15 flies.
