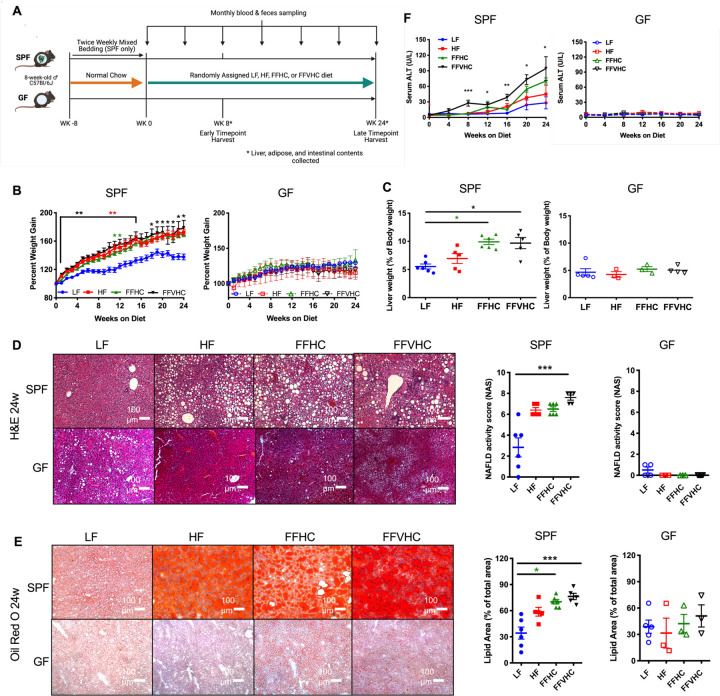
Figure 1. Dietary cholesterol level differentially impacts progression of NAFLD/NASH in specific-pathogen-free (SPF) but not germ-free (GF) mice after 24 weeks of feeding.
(A) Fast-food diet mouse model depicting experimental timeline indicating key timepoints and tissue collections in SPF and GF mice. (B) Percent body weight gain and (C) Liver weight expressed as % of body weight at 24 weeks in SPF and GF mice. (D) Formalin-fixed liver hematoxylin and eosin stain (H&E, right) and corresponding graphs represent NAFLD activity scores (NAS, left) of SPF and GF mice. All microscopy images were at 100x magnification. (E) Oil Red-O staining (left) and corresponding graph representing lipid area quantification in SPF and GF mice at 24 weeks. Representative images for all histology are shown for livers from each group. All microscopy images were at 100x magnification, Scale bars = 100 mm. (F) Time course of alanine aminotransferase (ALT) levels in peripheral plasma of SPF and GF mice. Data represent means ± S.E.M. *P < 0.05, **P < 0.01, ***P < 0.001 via nonparametric Kruskal-Wallis one-way ANOVA test followed by Tukey’s multiple comparisons between groups at each week or time point. n=4–6 per group. Star color represents the treatment group exhibiting significant differences.

