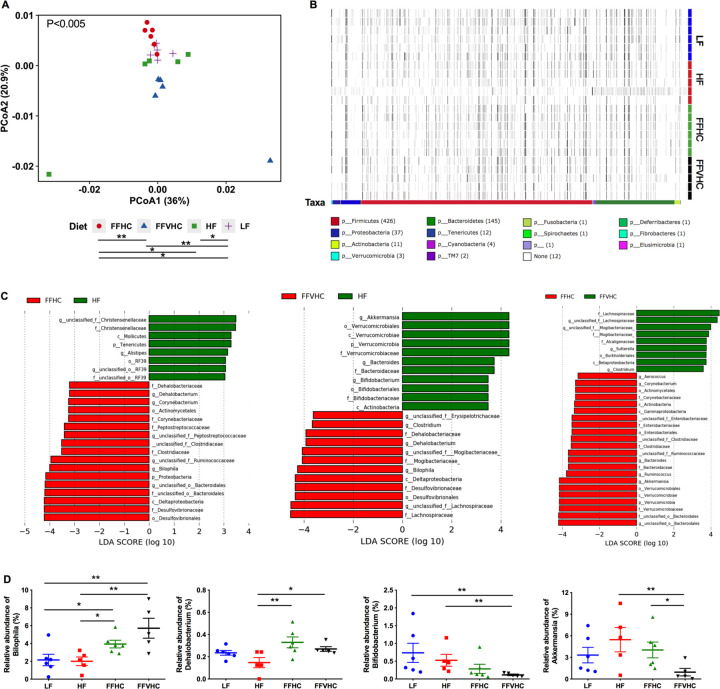
Figure 2. Fast-food diets significantly promote gut dysbiosis in cecal contents which is accompanied by NAFLD and NASH onset after 24 weeks of feeding.
(A) Beta diversity Principal Coordinate Analysis (PCoA) plots for Weighted Unifrac distances at week 24 (Axis 1 = principal coordinate (PC) 1; Axis 2 = PC 2). Symbols represent individual samples. (B) Heat map indicating relative abundances of Amplicon Sequence Variants (ASVs) in cecal bacteria composition induced by diet. Each column in the dendrogram represents an individual ASV. Each row represents an individual sample, organized by dietary treatment to the right of the heat map. Phyla-level taxonomic assignments are indicated by the colored bars at the bottom of the heat map. (C) Linear discriminant analysis effect size (LEfSe) analysis (LDA score [log10] bar graphs of differentially abundant taxa from cecum of HF vs. FFHC, HF vs. FFVHC, and FFHC vs. FFVHC mice at 24 weeks. Statistically significant taxa are presented (p<0.05) with an LDA score greater than ±3. Prefixes represent taxonomic rank, i.e., phylum (p__), class (c__), etc. (D) Relative abundance of significantly changed genera induced by FF diets identified by LEfSe with LDA scores greater than ±3.0. n=4–6 per group. Data represents mean ± S.E.M. *P < 0.05, **P < 0.01, ***P < 0.001 via nonparametric Kruskal-Wallis test followed by Turkey’s multiple comparisons across all groups.

