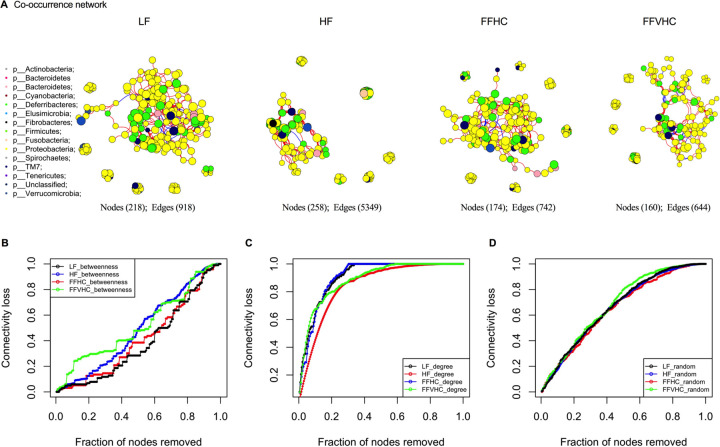
Figure 6. Network analysis reveals less resistant and unstable co-occurrence patterns in gut microbes among mice fed FF diets containing high cholesterol after 24 weeks.
A connection represents a strong (Spearman correlation coefficient of ρ>0.6 and significant (P<0.05) correlation. A, gut microbiota co-occurrence networks from mice fed LF diet, HF diet, FFHC diet, and FFVHC diet after 24 weeks. The vertices represent unique ASV features in each data set. The size of each vertex is proportional to the relative abundance of each ASV. Vertex color corresponds to phylum taxonomic classification. The edge thickness is equivalent to correlation values. (B-D) Error and attack tolerance tests were performed stepwise by removing vertices from the network in decreasing order of betweenness (B), closeness (C) and randomly (D) and recording the network’s loss of connections (edges).

