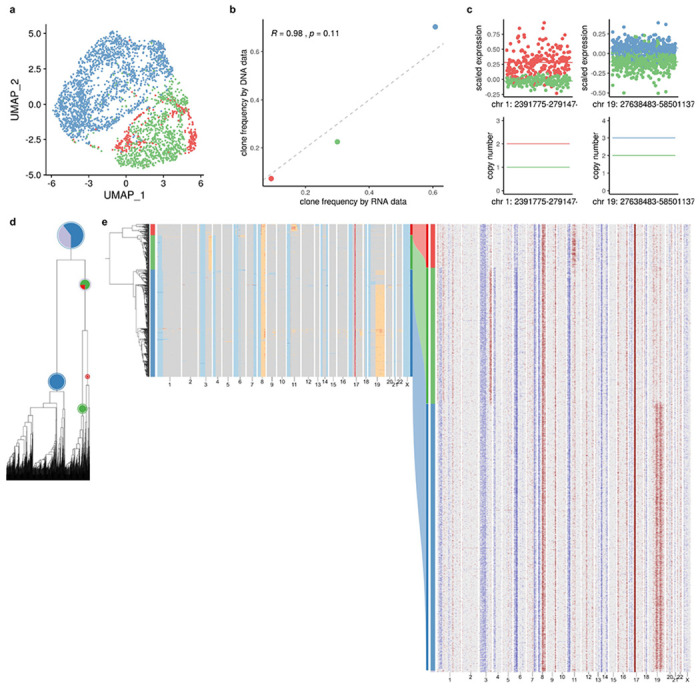
Extended Data Fig. 4: TreeAlign assigns expression profiles of NCI-N87 to phylogeny.

a, UMAP plot of scRNA-data from gastric cell line NCI-N87 colored by clone labels assigned by total CN TreeAlign. b, Clone frequencies of NCI-N87 estimated by scRNA-data (x axis) and scDNA-data (y axis). c, Scaled expression and copy number profiles for regions on chromosome 1 and 19 as a function of genes ordered by genomic locations. d, Phylogenetic tree constructed with scDNA-data. e, Phylogenetic tree constructed with scDNA-data along with pie charts showing how TreeAlign assigns cell expression profiles to subtrees recursively. The pie charts are colored by the proportions of cell expression profiles assigned to downstream subtrees. The outer ring color of the pie charts indicates the current subtree. Heat maps of copy number profiles from scDNA (left) and InferCNV corrected expression profiles from scRNA (right). The Sankey chart in the middle shows clone assignment from expression profiles to copy number based clones by total CN TreeAlign.
