
Fig. 4: Incorporating allele specific expression increases clone assignment resolution.
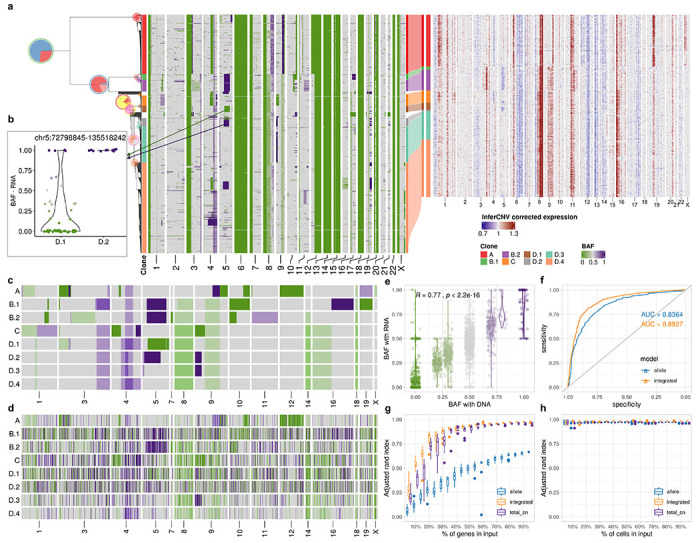
a, Integrated TreeAlign model assigns expression profiles to phylogeny of patient 022. Left heat map, single cell BAF profiles estimated from scDNA-data using SIGNALS, annotated with clone labels on the left side (BAF profiles without clone label represent cells ignored by TreeAlign) (Methods). b, BAF estimated from scRNA in clone D.1 and D.2 at region chr5:72,798,845-135,518,242. c-d, BAF of subclones with (c) scDNA and (d) scRNA. e, Correlation between BAF estimated with scRNA and BAF estimated with scDNA in patient 022. Annotations at the top indicate the Pearson correlation coefficient (R) and P value derived from a linear regression. f, ROC curves for predicting p(a = 1) with allele-specific TreeAlign and integrated TreeAlign. g, Robustness of clone assignment to gene subsampling in patient 022. Adjusted rand index was calculated by comparing clone assignments using subsampled datasets to the complete dataset. h, Robustness of clone assignment to cell subsampling in patient 022.