
Fig. 5: Inferring copy number dosage effects in human cancer data.
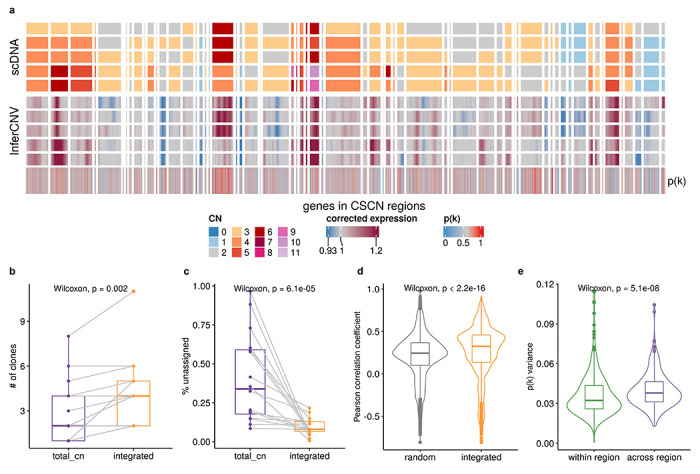
a, Heat map representations of genes in CSCN regions in HGSC sample SA1096. Top heat map: clone-level total copy number from scDNA; bottom heat map: InferCNV corrected expression profiles from scRNA; bottom track: p(k) estimated by TreeAlign. b, Number of clones characterized by total CN and integrated model (Wilcoxon signed-rank test). c, Frequencies of unassigned cells (Methods) from total CN and integrated model (Wilcoxon signed-rank test). d, Distribution of Pearson correlation coefficients (R) between scDNA estimated total copy number and InferCNV corrected expression for unassigned cells from total CN model. Left, correlation distribution calculated by comparing InferCNV profiles to CN profiles of a random subclone; Right, correlation distribution calculated by comparing InferCNV profiles to CN profiles of subclones assigned by integrated TreeAlign. c, Variance of p(k) sampled from the same genomic regions and across regions.