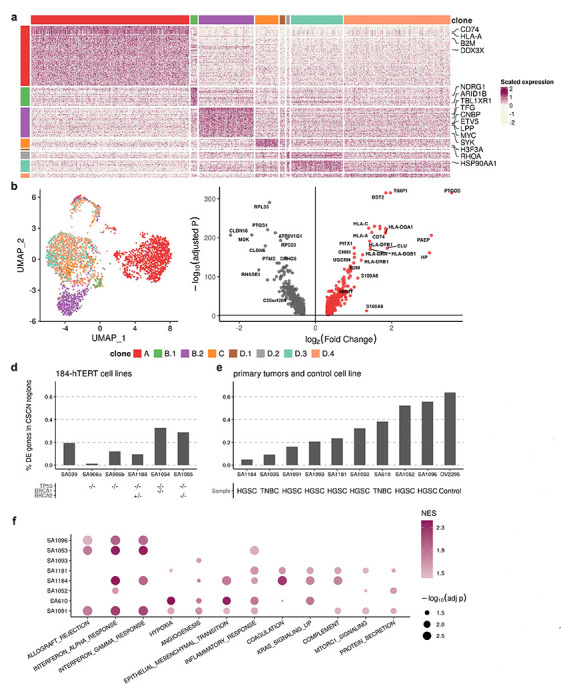
Fig. 6: Clone-specific transcriptional profiles highlight clonal divergence in immune pathways.

a, Scaled expression of upregulated genes in each subclone in patient 022, showing genes in rows and subclones in columns. Genes in the COSMIC Cancer Gene Census42 are highlighted. b-c, Proportions of subclonal differentially expressed genes located in CSCN regions for (b) 184-hTERT cell lines, (c) an HGSC control cell line and primary tumors. d, UMAP embedding of expression profiles from patient 022 colored by clone labels assigned by integrated TreeAlign model. e, Differentially expressed genes between clone A and other subclones (clone B - D) in patient 022. f, Pathways with clone-specific expression patterns in TNBC and HGSC tumors.
