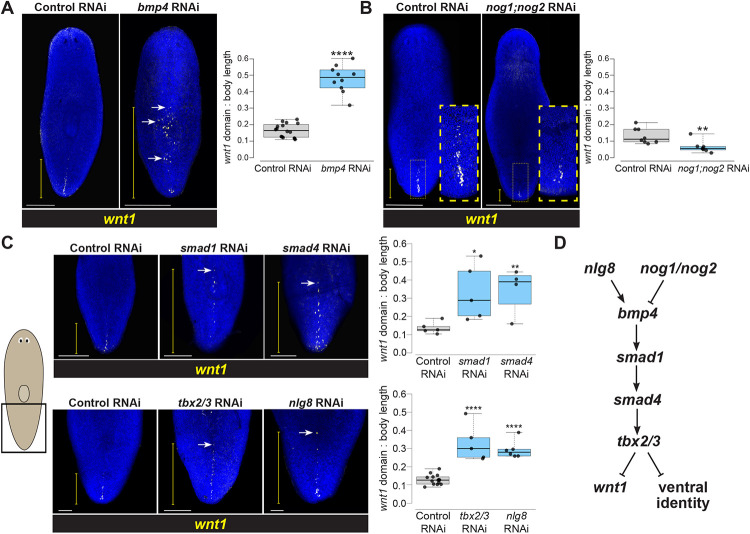
Fig. 2. A BMP signaling pathway involved in DV identity restricts wnt1 expression to the posterior.
(A) FISH detecting wnt1 expression in animals following 14 days of homeostatic control or bmp4 RNAi. Inhibition of bmp4 expanded wnt1 expression toward the anterior (white arrow shows ectopic wnt1+ cells). (B) wnt1 expression domain reduced in nog1;nog2(RNAi) animals treated with dsRNA for 18 days of homeostasis (yellow boxes, magnified insets). (C) Top: FISH of wnt1 following 14 days of control, smad1, or smad4 RNAi Bottom: FISH detecting wnt1 after 18 days of control, tbx2/3, or nlg8 RNAi. Inhibition of these BMP signaling components results in anterior expansion of wnt1 expression. (A-C) White scale bars represent 150 μm, and yellow brackets indicate wnt1 AP expression domain size. Box plots showing the distance from the posterior tip of the animal to the most anterior wnt1 expression relative to body length after indicated treatments. *p<0.05, **p<0.01, ***p<0.001, ****p < 0.0001 by 2-tailed t-test; N ≥ 4 animals. Box plots show median values (middle bars) and first-to-third interquartile ranges (boxes); whiskers indicate 1.5× the interquartile ranges, and dots are data points from individual animals. (D) Pathway model for components acting in DV determination and control of wnt1.

