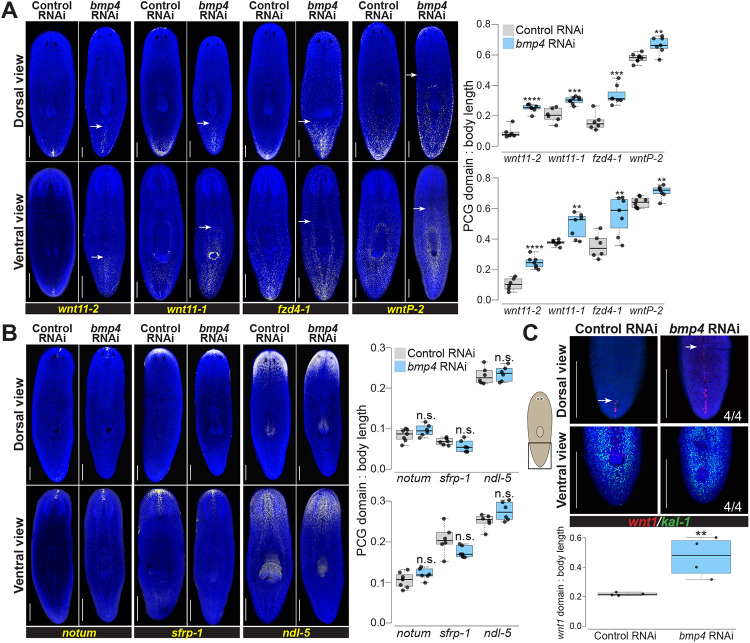
Fig. 3. bmp4 restricts posterior identity independent of DV control.
(A) Animals were fixed after 28 days of homeostatic control or bmp4 RNAi and stained by FISH as indicated for markers of the AP axis identity. bmp4 RNAi caused an anterior expansion of the posterior markers wnt11-2, wnt11-1, fzd4-1, and wntP-2 on both dorsal and ventral sides. White arrows indicate the expansion of posterior markers. (B) FISH stained animals following 28 days of control or bmp4 RNAi. bmp4 inhibition did not affect AP distribution of anterior markers notum, sfrp-1, or ndl-5. (A-B), Graphs show the measurement of indicated marker domains normalized by total length of animal (N ≥ 6 animals). (C) FISH showing wnt1 and ventral marker kal-1 expression comparing 14 days of control and bmp4(RNAi). Dorsal view (upper) shows that inhibition of bmp4 expanded wnt1 expression anteriorly (arrows indicate anterior-most wnt1+ cell) at a time prior to any dorsal expression of the ventral marker kal-1 expression (4/4 animals). Boxplot comparing wnt1 expression normalized by body length between control and bmp4(RNAi) animals (N = 4 animals). (A-C) Box plots shows median values (middle bars) and first-to-third interquartile ranges (boxes); whiskers indicate 1.5× the interquartile ranges and dots are data points from individual animals. *p<0.05, **p<0.01, ***p < 0.001, ****p<0.0001, n.s. indicates p>0.05 by 2-tailed t-test. Scale bars, 300 μm (A-B) or 150 μm (C).

