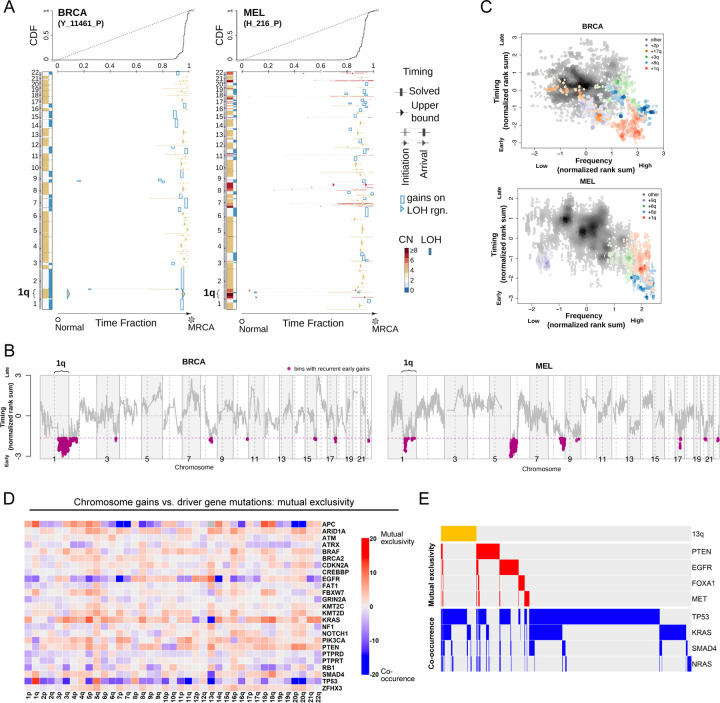
Figure 1. Specific chromosome gains arise early in tumor development and are mutually-exclusive with driver gene mutations.
(A) The inferred timing of somatic copy number gains in the evolution of two tumors. A breast tumor is shown on the left and a melanoma on the right. Copy number (CN) states along the genome are shown on the left in each panel and color coded. The plot visualizes the time fraction of somatic evolution from germline to the most recent common ancestor (MRCA) of the patient tumor sample. For each copy number segment, the inferred timing is shown as a rectangle (exactly solved timing) or an arrow (upper bounds of timing when the timing solutions are not unique) with the same color-coding as its CN. The top panel shows the cumulative distribution (CDF) of the timing. Genome doubling (GD) can be observed as the punctuated gains occurring in a narrow time window and chromosome 1q gains appear to be extremely early and preceding GD in these two tumors.
(B) Recurrent early gains of chromosome 1q in BRCA and MEL. For each tumor type, we converted the timing of gains into ranks for genomic bins within a patient and computed the rank sums across patients for each bin. The normalized rank sums for each genomic bin are shown for BRCA and MEL, respectively. The large negative values indicate recurrent early initiating gains. We used the normalized rank sums to test against the null hypothesis (no regions show recurrent early gain across patients). Bins from chromosome 1q reject this null for both tumor types (with 90% confidence level).
(C) The timing of a gain compared to the frequency of its occurrence in BRCA and MEL. The points on the plots show the timing of gain of a genomic bin versus its frequency of copy number gain. Colors represent chromosomal arms, and color darkness indicates the density of points. Both the timings and frequencies are transformed into normalized rank sums (see Methods).
(D) A pan-cancer analysis of mutual exclusivity between mutations in 25 commonly-mutated cancer genes and chromosome arm gain events. The complete results of this analysis are included in Table S1.
(E) Mutual exclusivity and co-occurrence patterns between one representative chromosome gain (+13q, orange bars at the top), and point mutations in several different cancer driver genes.

