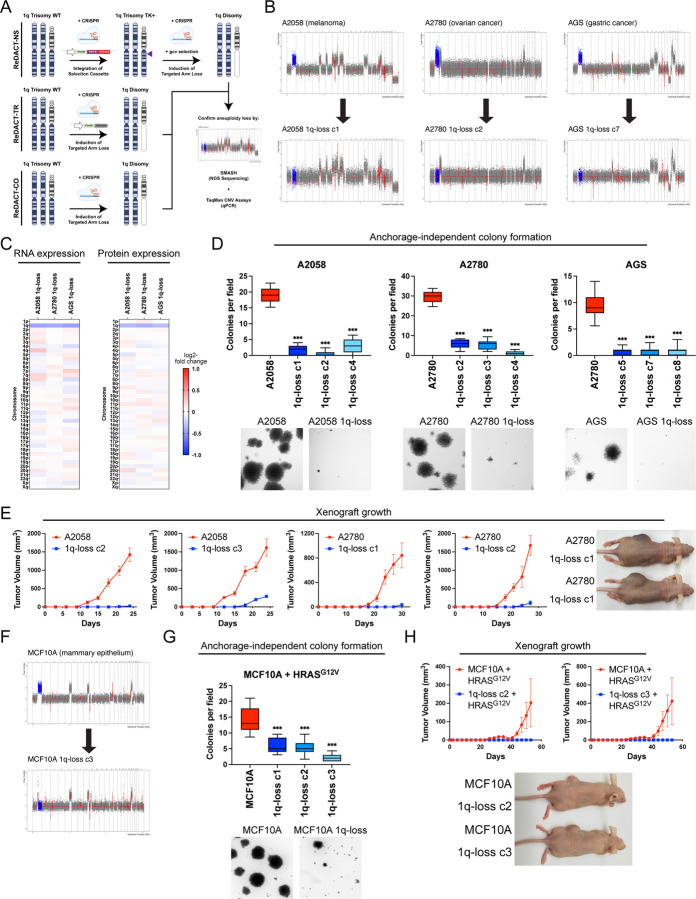
Figure 2. Phenotypic effects of losing chromosome 1q-aneuploidy.
(A) Chromosomal engineering strategies for the targeted deletion of chromosome arms: (1) ReDACT-NS: using CRISPR-Cas9 homology-directed repair, we integrated a positive-negative selection cassette encoding a fluorescent reporter, a positive selection marker, and a negative selection marker (HSV thymidine kinase) at a centromere-proximal region on chromosome 1q. We induced arm loss by generating a dsDNA break centromere-proximal to the cassette with Cas9, and isolated clonal populations of cells that were ganciclovir-resistant. (2) ReDACT-TR: We induced arm loss by generating a dsDNA break at a centromere-proximal location with Cas9 while providing cells with an ectopic telomere seed sequence for repair. (3) ReDACT-CO: We induced arm loss by generating a dsDNA break at a centromere-proximal location with Cas9, and isolated clonal populations of cells. For all three approaches, we screened clonal populations of cells for targeted chromosome loss through TaqMan CNV assays and validated their karyotypes through SMASH sequencing.
(B) Representative SMASH karyotypes of the 1q-disomic clones generated from the 1q-trisomic cancer cell lines A2780, AGS, and A2058. Chromosome 1q is highlighted in blue. A complete list of aneuploidy-loss clones is included in Table S3.
(C) 1q-disomic clones display decreased RNA expression and protein expression of genes encoded on chromosome 1q. RNA expression data was obtained through bulk RNA-seq and represents the average expression of genes by chromosome arm across multiple 1q-disomic clones for each cell line. Protein expression data was obtained through mass spectrometry, and representative data from one 1q-disomic clone is shown for each cell line. Data are log2 transformed, normalized to the parental cell line, and adjusted so that the mean expression across all chromosomes is 0.
(D) 1q-disomic clones exhibit decreased anchorage-independent growth. The micrographs display representative images of colony formation for 1q-trisomic and 1q-disomic clones.
(E) 1q-disomic clones exhibit impaired xenograft growth in vivo. 1q-trisomic and 1q-disomic cells were injected contralaterally and subcutaneously into immunocompromised mice. The graphs display the mean ± SEM for each trial. Representative mice are shown on the right.
(F) SMASH karyotype of a 1q-disomic clone generated from the mammary epithelial cell line MCF10A. Chromosome 1q is highlighted in blue.
(G) 1q-disomic MCF10A clones transduced with HRASG12V exhibit decreased anchorage-independent growth relative to 1q-trisomic MCF10A cells.
(H) 1q disomic MCF10A clones transduced with HRASG12V clones exhibit impaired xenograft growth in vivo. 1q-trisomic and 1q-disomic cells were injected contralaterally and subcutaneously into immunocompromised mice. The graphs display the mean ± SEM for each trial. Representative mice are shown below.
For anchorage-independent growth assays in D and G, the boxplots represent the 25th, 50th, and 75th percentiles of colonies per field, while the whiskers represent the 10th and 90th percentiles. Unpaired t-test, n = 15 fields of view, data from representative trial. Representative images are shown below. **p < 0.005, ***p < 0.0005

