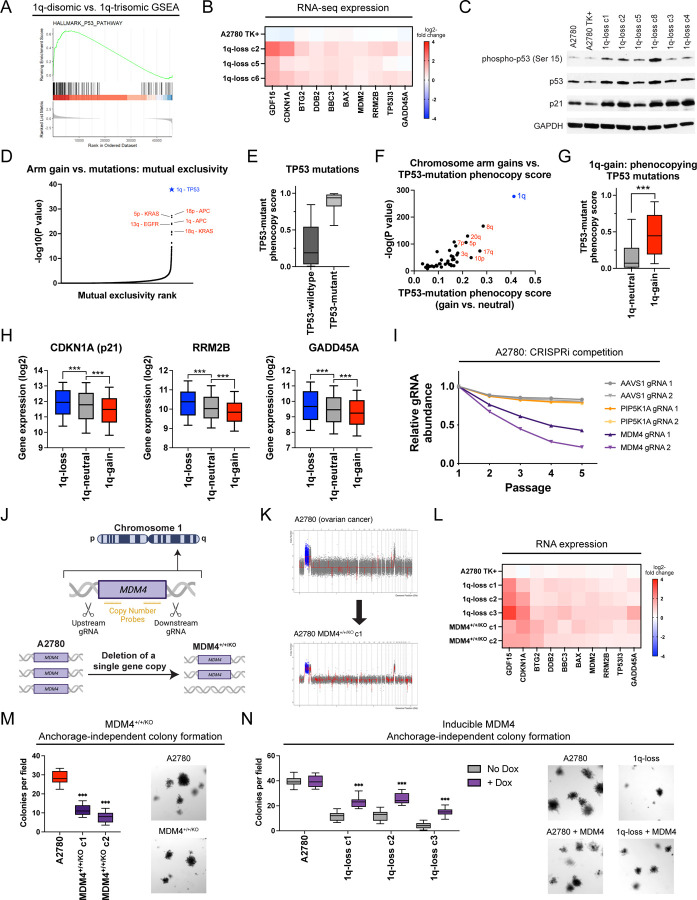
Figure 5. A single extra copy of MDM4 suppresses TP53 signaling and contributes to the 1q-trisomy addiction.
(A) GSEA analysis of A2780 RNA-seq data reveals upregulation of the p53 pathway in the 1q-disomic clones, relative to the parental trisomy.
(B) A heatmap displaying the upregulation of 10 p53 target genes in A2780 1q-disomic clones. The TK+ clone indicates a clone that harbors the CRISPR-mediated integration of the HSV-TK transgene but that was not treated to induce chromosome 1q-loss.
(C) Western blot analysis demonstrating activation of p53 signaling in 1q-disomic clones. GAPDH was analyzed as a loading control. The TK+ clone indicates a clone that harbors the CRISPR-mediated integration of the HSV-TK transgene but that was not treated to induce chromosome 1q-loss.
(D) A waterfall plot highlighting the most-significant instances of mutual exclusivity between chromosome arm gains and mutations in cancer-associated genes. The complete dataset for mutual exclusivity and co-occurrence is included in Table S1.
(E) Boxplots displaying the TP53-mutation phenocopy signature57 in cancers from the TCGA, split based on whether the cancers harbor a non-synonymous mutation in TP53.
(F) A scatterplot comparing the association between chromosome arm gains and the TP53-mutation phenocopy signature57 in TP53-wildtype cancers from TCGA. Cancers with chromosome 1q gains are highlighted in blue.
(G) Boxplots displaying the TP53-mutation phenocopy signature57 in cancers from the TCGA, split based on whether tumors harbor a gain of chromosome 1q. Only TP53-wildtype cancers are included in this analysis.
(H) Boxplots displaying the expression of three p53 target genes – CDKN1A (p21), RRM2B, and GADD45A – in cancers from TCGA split based on the copy number of chromosome 1q. Only TP53-wildtype cancers are included in this analysis.
(I) A CRISPRi competition assay demonstrates that gRNAs targeting MDM4 drop out over time in A2780 cells. In contrast, gRNAs targeting AAVS1 and PIP5K1A, another gene encoded on chromosome 1q, exhibit minimal depletion.
(J) A schematic displaying the strategy for using paired CRISPR gRNAs to delete a single copy of MDM4 in a cell line with a trisomy of chromosome 1q.
(K) SMASH karyotype demonstrating maintenance of the chromosome 1q trisomy in an MDM4+/+/KO clone. Chromosome 1q is highlighted in blue.
(L) 1q-disomic clones and MDM4+/+/KO clones in A2780 exhibit comparable upregulation of p53 transcriptional targets, as determined through TaqMan gene expression assays.
(M) MDM4+/+/KO clones exhibit decreased anchorage-independent growth relative to the MDM4+/+/+ parental cell line.
(N) Induction of MDM4 cDNA in 1q-disomic clones in A2780 increases anchorage-independent growth.
For the graphs in E, G, H, M, and N, the boxplots represent the 25th, 50th, and 75th percentiles of the indicated data, while the whiskers represent the 10th and 90th percentiles of the indicated data. For the soft agar experiments in M and N, the data are from n = 15 fields of view, and a representative trial is shown.
***p < 0.0005

