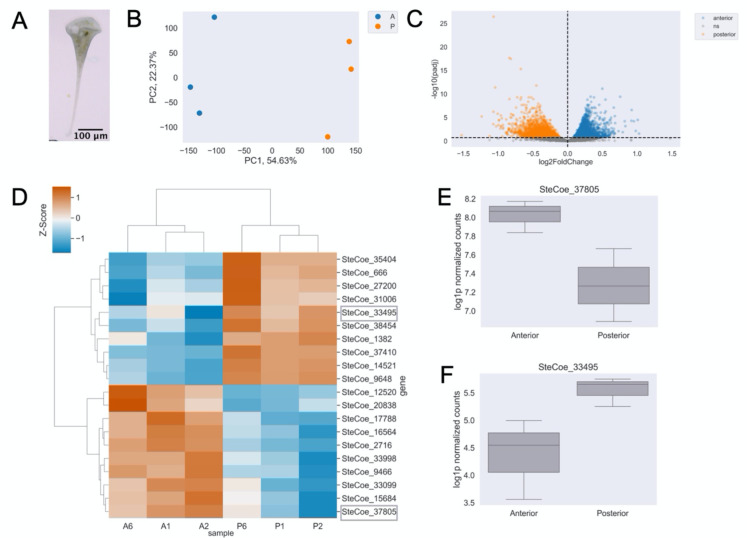
Figure 1. Bulk RNA sequencing reveals RNAs are patterned along the anterior-posterior axis in Stentor coeruleus.
(A) Stentor coeruleus. (B) Principal Component Analysis (PCA) showing a clear separation of anterior (color) and posterior (color) samples based on their mRNA abundance profiles. (C) Volcano plot displaying results of differential enrichment analysis of anterior vs. posterior mRNA abundances. Points correspond to individual genes. Statistically significantly differentially enriched genes (q-value < 0.2) in the anterior are blue, posterior in orange, and not significant in gray. (D) Heatmap of relative abundance (z-scores) where rows correspond to individual genes and columns are samples for the top 10 enriched genes in anterior or posterior samples. Red indicates higher enrichment and blue indicates relative depletion. Representative genes in (E,F) circled in gray. (E) Representative example and boxplot of log-normalized counts of an anterior-enriched message, SteCoe_37805. (F) Representative example and boxplot of log-normalized counts of a posterior-enriched message, SteCoe_33495.

