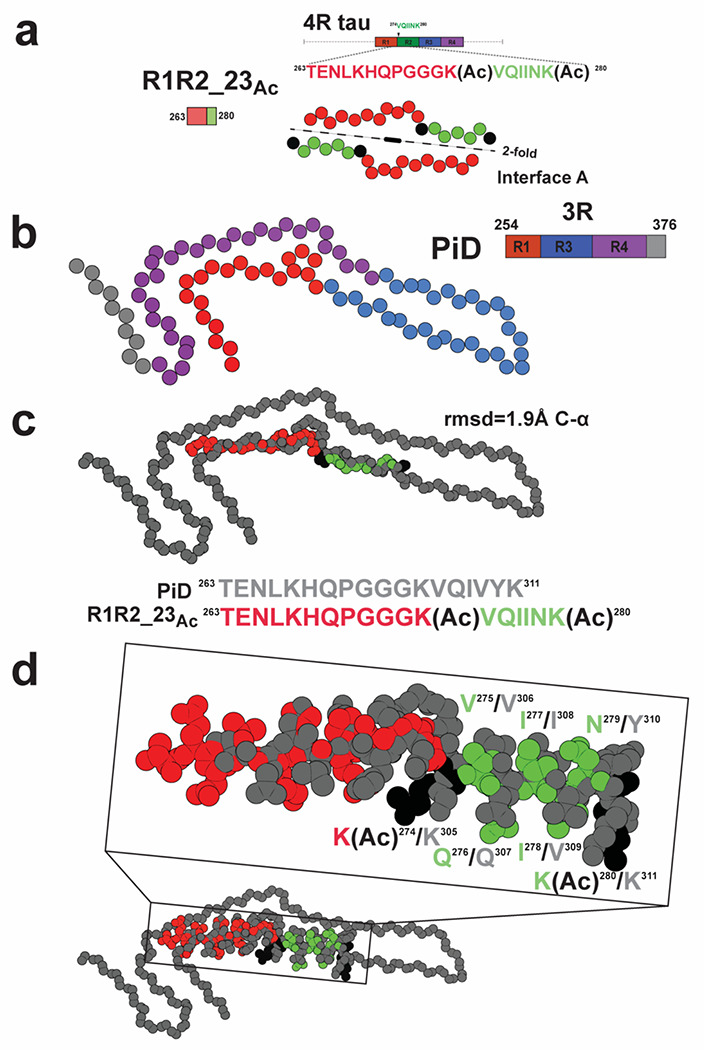
Figure 4. Similarity of the R1R2_23ac structure to the disease-derived Pick’s fibril.

a. Schematic illustrating the R1R2 23Ac core sequence (top). View of the core of the R1R2 23Ac fragment highlighting the 2-fold “interface A” interaction (bottom). Acetylation sites are shown in black. Fragments are colored as in Fig. 1a. Structure is shown as spheres with Ca and is colored as in Fig. 1a. b. Illustration of a monomer layer from a protofilament of a PiD fibril (PDB id 6gx5) encoding residues 254-376. Structure and schematic is colored as in Fig. 1a. Structure is shown as spheres with C-a. c. Overlay of the R1R2 23Ac core fragment (one chain) with the equivalent sequence in the PiD structure reveals 1.8 Å C-a atom r.m.s.d. (top). Comparison of the equivalent sequences in PiD and R1R2 23 Ac that were aligned (bottom). PiD and R1R2 23Ac structures/sequence are colored grey and red/green, respectively. Acetylated lysines are colored in black. The structures are shown as spheres with backbone-only. d. Full-atom alignment of the R1R2 23Ac to the homologous region in the PiD structure. Key residues from the 275VQIINK280 and 306VQIVYK311 motifs are highlighted. Residues are numbered according to the 4R nomenclature and colored as in Fig. 4c. Structures are shown in space fill with all-atoms.
