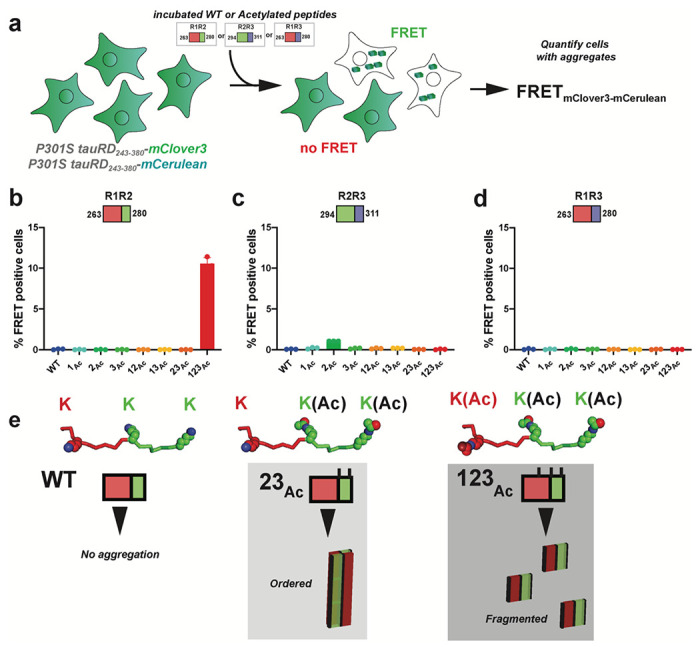
Figure 5. Measuring cellular tau aggregation to acetylated peptide aggregates.

a. Schematic of the cell-based tau aggregation assay. Tau repeat domain is expressed as a fusion to mClover3 and mCerulean. Incubated peptides (WT or Acetylated) are transduced into the tau expressing cells and evaluated for conversion of the intracellular tau into aggregates as measured by FRET on a flow cytometer. Quantification of FRET signal across all peptides transduced into the tau biosensor cells: R1R2 (b), R2R3 (c) and R1R3 (d). Bar plots are colored as in Fig. 2. Data is shown as averages across three experiments with error bars representing a 95% CI of each condition. e. Model for how specific acetylation patterns on the R1R2 drive formation of fibrils but not all lead to seeding cells. The WT R1R2 sequence does not aggregate (left). The R1R2 23Ac pattern (middle) leads to large ordered aggregates while the R1R2 123Ac modified peptide (right) leads to more fragmented seeds which promote rapid aggregation in cells.
