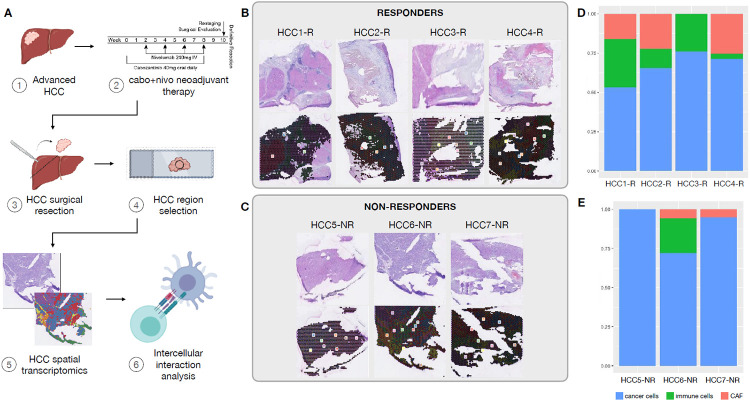
FIGURE 1.
Spatial transcriptomics analysis of HCC samples treated with cabozantinib and nivolumab. A. Experimental workflow. B. Hematoxylin and eosin (H&E) stained images of the samples profiled and the spatial clusters for responders. C. H&E and spatial clusters for non-responders. D. Tumor, immune and cancer associated fibroblasts composition in each responder samples as determined by spatial transcriptomics. E. Tumor, immune and cancer associated fibroblasts proportions in non-responders samples.

