FIGURE 4.
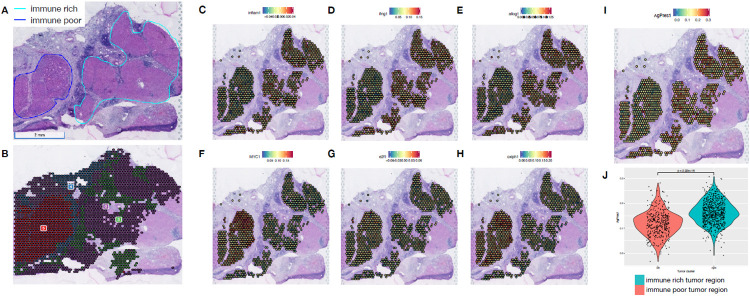
Intra-sample heterogeneity analysis with spatial transcriptomics. A. Responder sample with remarkable heterogeneity with two tumor regions, one immune-rich (cyan) and one immune-poor (dark blue). B. Each of these regions present distinct transcriptional profiles as determined by clustering analysis. C, D and E. The immune rich tumor region highly expresses immune related pathways that were initially observed to be enriched across responders’ samples. F, G and H. Proliferation and metabolic pathways, that are enriched across non-responders’ tumors, are expressed in high levels at the immune poor region. I. The immune rich tumor region expresses high levels of the antigen processing and presentation machinery genes, which is associated with more efficient attraction of immune cells.

