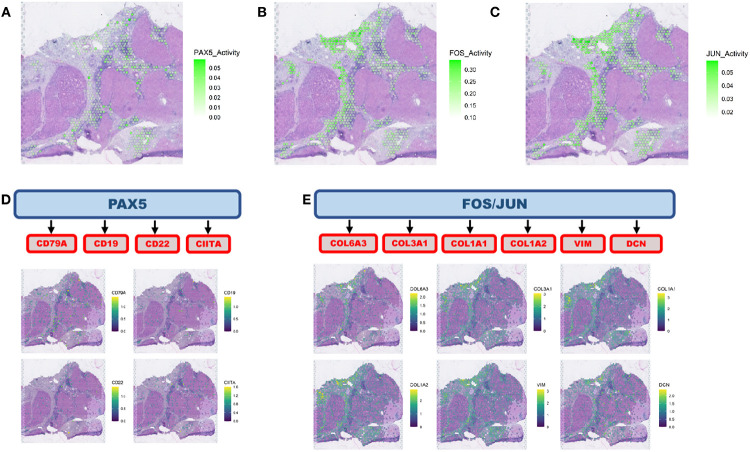
FIGURE 5.
Intercellular interaction analysis in the context of intra-sample heterogeneity. A. Intercellular interaction analysis in immune rich tumor region (cancer-immune) reveals activation of PAX5. B and C. FOS and JUN are the active networks from the interaction analysis at the immune poor tumor region (cancer-CAF). D. PAX5 activation co-localizes with the expression of B cell markers concentrated at the borders of the immune rich tumor region. E. FOS and JUN networks are co-expressed with CAF markers adjacent to the immune poor tumor region.

