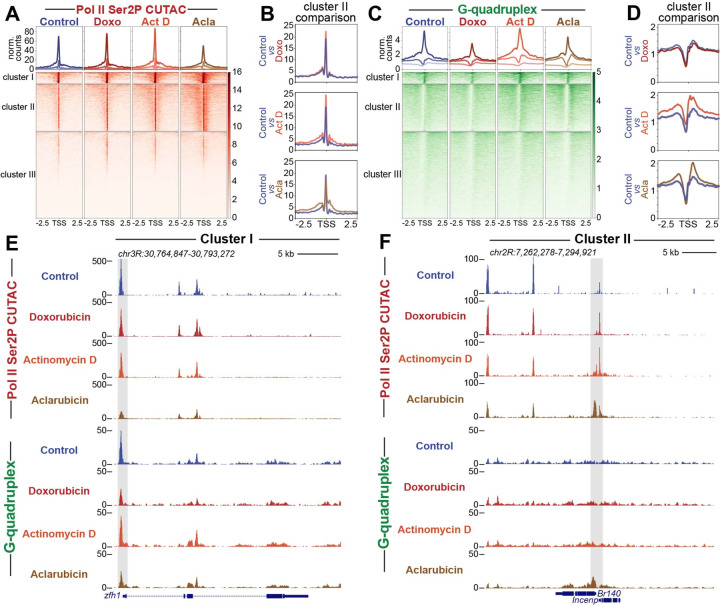
Fig. 2: Drug treatment impacts chromatin accessibility and G-quadruplex formation.
(A) Heatmap aligned to TSS of all promoters showing normalized counts of CUTAC chromatin accessibility targeting RNA Pol II ser2P clustered via k-means clustering (k=3). (B) Enlarged comparison of accessibility differences between different drug groups and controls. (C) Heatmap aligned to the transcriptional start site (TSS) of all promoters showing normalized counts of G-quadruplex CUT&Tag signal clustered via k-means clustering (k=3). (D) Enlarged comparison of G-quadruplex differences between different drug groups and controls. (E) Representative UCSC browser track snapshot of CUTAC and G-quadruplex distribution at cluster I gene. Gray box indicates promoter region. (F) Representative UCSC browser track snapshot of G-quadruplex distribution at Cluster II gene. Gray box indicates promoter region.

