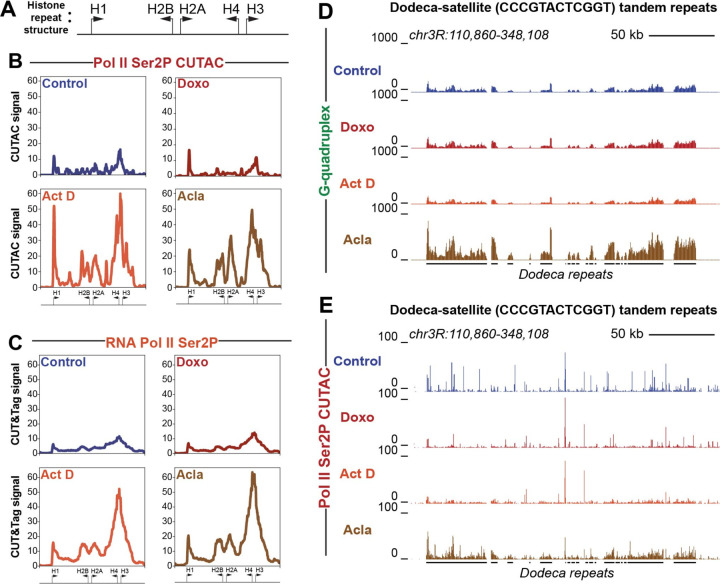
Fig. 4: Histone cluster and Dodeca-satellite repeats show distinct responses to drug treatment.
(A) Cartoon showing divergent orientation of histone cluster genes. Arrows indicate direction of transcription with the base of the arrow representing approximate promoter position. (B) Average coverage plot of histone cluster showing normalized counts of CUTAC signal targeting RNA Pol II ser2P. (C) Average coverage plot of histone clusters showing normalized counts of CUT&Tag data targeting RNA Pol II ser2P. Arrows at the bottom of average plots indicate approximate positions of histone genes cartooned in panel A. (D) UCSC browser track snapshot of G-quadruplex CUT&Tag data at Dodeca-satellite repeats. (E) UCSC browser track snapshot of RNA Pol II Ser2P CUTAC data at Dodeca-satellite repeats. Black lines below the browser tracks indicate location of Dodeca-satellite repeats.

