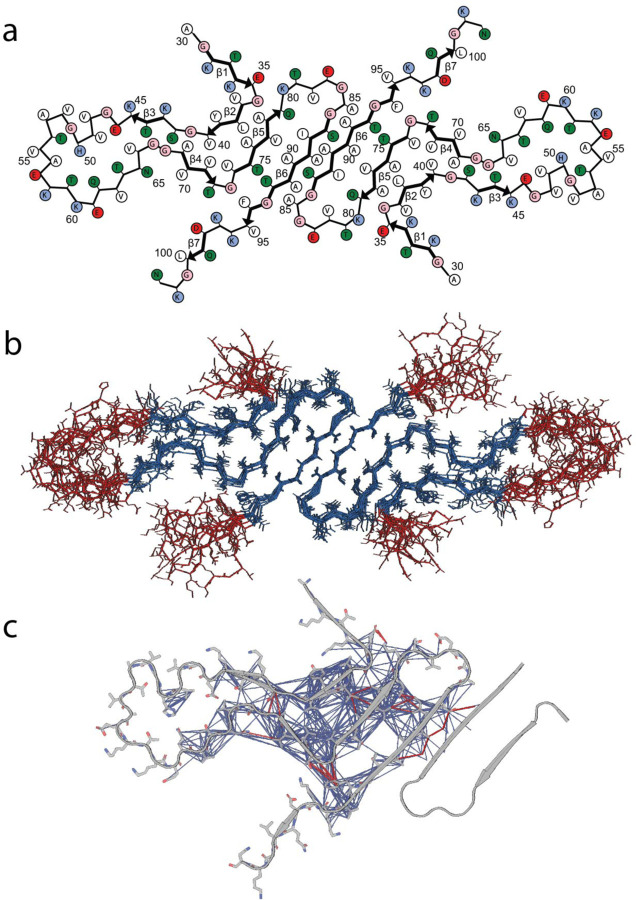
Fig. 5: Structure of LBD fibrils.
a, Cartoon representation of the LBD fibrils determined via SSNMR studies. b, 10 lowest energy structures of LBD fibril determined. Blue represent well-ordered regions with large amount of intermolecular contacts; red represent relatively disordered regions with few intermolecular contacts detectable using CP based polarization techniques. c, Inter-residue contacts identified from SSNMR CP based experiments. Magenta lines are intramolecular contacts manually identified within spectra, blue lines are correlations identified utilizing the PASD algorithm for probabilistic assignments.

