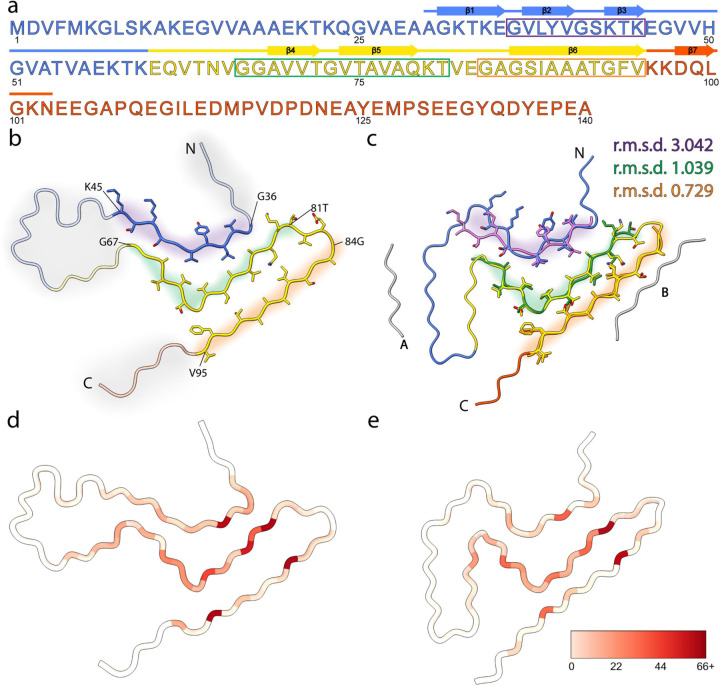
Fig. 7: ssNMR structure of amplified Asyn resembles cryo-EM structure of extracted filaments.
a, Primary sequence of human Asyn, with beta-strands annotated with arrows. The amphipathic N-terminal region, hydrophobic non-amyloid beta-component of plaque (NAC) region, and acidic C-terminal region are colored blue, yellow, and red, respectively. The purple, green, and orange rectangles denote the residue ranges used for subsequent comparison studies. b, Atomic model of SSNMR LBD Asyn core structure with labeled N- and C- termini (PDB 8FPT). Areas of low confidence are depicted with transparent cartoons with grey highlights. Residue ranges modeled with high confidence are depicted as cartoons with sidechains as sticks and are highlighted in purple, green, and orange. c, Atomic model of cryo-EM LBD Asyn core structure (PDB 8A9L), colored as in b. The unidentified proteinaceous islands are in grey. High-confident residue ranges of the SSNMR structure are overlayed in purple, green, and orange, and root-mean-square deviations (r.m.s.d) of the main-chain atoms were calculated. d, Number of satisfied NMR-derived interatomic distances mapped onto the lowest-energy structure using Xplor-NIH calculations on a per-residue basis using initial assignments from PASD. The color scale extends from white, indicating few or no NMR-derived distances were observed for the residue, to red, indicating many NMR-derived distances were observed for the residue. e, Number of satisfied NMR-derived distances mapped onto the cryo-EM Asyn core structure (PDB 8A9L).

