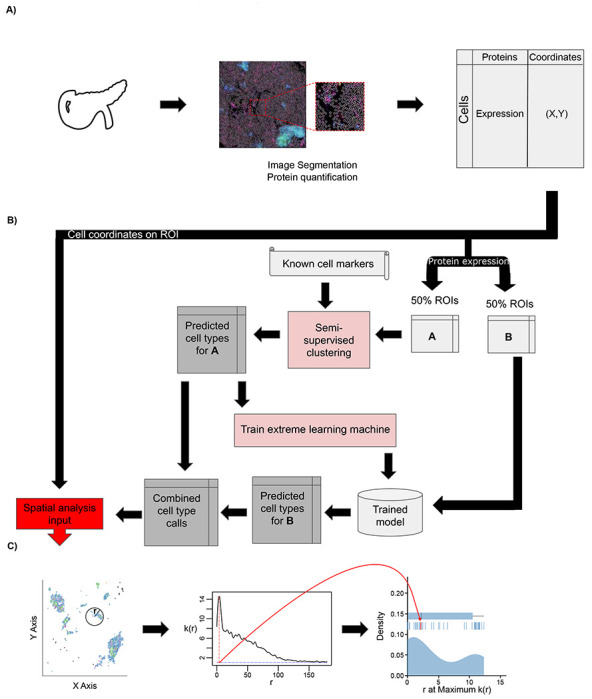
Figure 1:

Overview of IMC or CODEX data analysis with AnnoSpat (Annotator and Spatial Pattern Finder). (A) From left to right: A tissue’s region of interest (ROI) (e.g. from the pancreas) is measured using a spatial single-cell proteomics assay such as IMC or CODEX, reporting position and protein expression levels of individual cells in situ. (B) To overcome lack of manually annotated training data, AnnoSpat’s Annotator module learns a cell-type predictor by first processing protein expression data with a semi-supervised clustering algorithm, which creates a training dataset from a subset of cells in the overall dataset (e.g. 50% in matrix A). Using this automatically generated training data, AnnoSpat then trains and applies an extreme learning machine classifier to label the remaining cells (e.g. 50% in matrix B). (C) AnnoSpat’s Spatial Pattern Finder component interprets cell locations as point processes to quantify relationships between cell types using distance-dependent (r) mark cross-correlation function (k(r)). Mark cross-correlation functions across ROIs are systematically summarized using different features of them such as the distance where the function is maximal.
