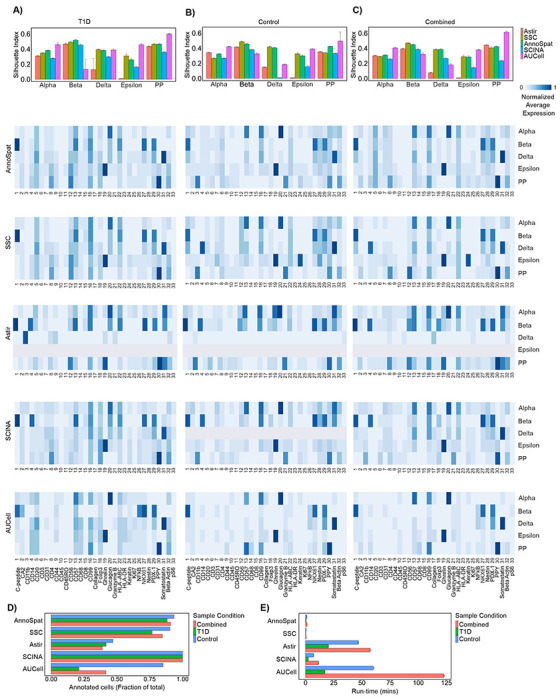
Figure 2:

Comparative analysis of AnnoSpat cell-type annotation from IMC data. (A) From top to bottom: bar plots with error bars showing average and standard deviation Silhouette Index (SI), heatmaps showing marker proteins’ normalized average expressions for cells annotated as alpha, beta, delta, epsilon, and PP by AnnoSpat, semi-supervised clustering (SSC), Astir, SCINA, and AUCell from T1D pancreas IMC data (n = 374, 397 measured cells). (B) Similar to (A) from non-diabetic (control) pancreas IMC data (n = 795, 604 measured cells). (C) Similar to (A) from combined T1D and control pancreas IMC data (n = 1, 170, 001 measured cells). m = 10 sets of n = 50, 000 randomly selected cells are used for evaluation using SI in each bar plot in top panel of A-C. (D) Bar plots showing the fraction of n = 374, 397, n = 795, 604, and n = 1, 170, 001 IMC-measured cells form T1D, control, and combined T1D and control pancreata, respectively, annotated by AnnoSpat, SSC, Astir, SCINA, and AUCell. (E) Bar plots with error bars showing mean and standard deviation of run-time for the listed algorithms to annotate cells as in (D). Each algorithm was run three times on a machine with Ubuntu 20.04, 1.05TB Memory, Intel Xeon Gold CPU 6230R @ 2.1GHz, 2 physical processors 52 cores, and 104 threads.
