Figure 5:

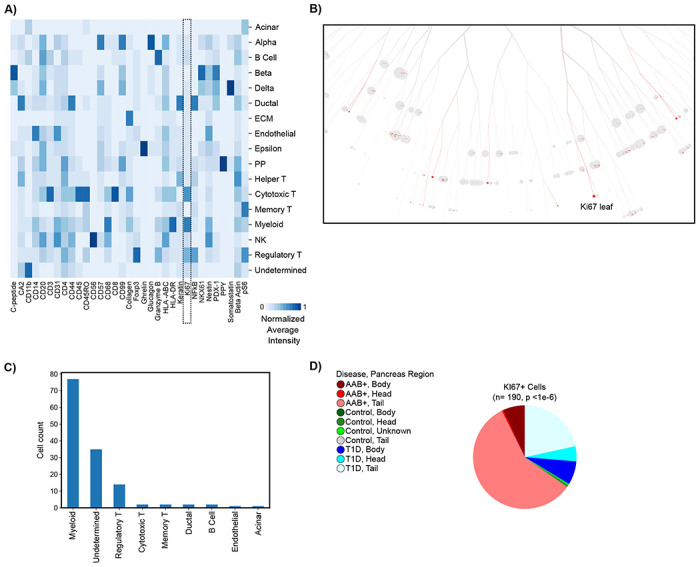
Myeloid and regulatory T cells are hyper-proliferative in T1D pancreata. (A) Heatmap showing normalized average expression of 33 IMC-measured proteins across AnnoSpat-annotated cell types. Dash-lined box marking Ki67 column. (B) TooManyCells sub-tree colored by Ki67 expression. (C) Bar plots showing cell-type count of n = 190 cells within the TooManyCells sub-tree in (B). (D) Pie chart showing fraction of Ki67+ cells from different regions of pancreata of control, T1D, and AAb+ donors (p-value: chi-square test).
