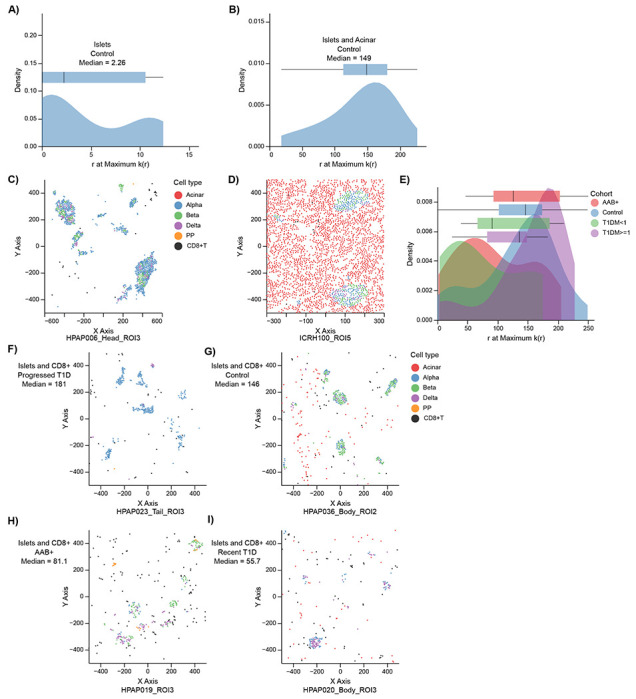
Figure 6:

The extent of CD8+ T cell infiltration in islets changes during T1D progression. (A, B) Distributions with box-and-whisker plot overlays of distance r at the maximum value of k(r) across all ROIs for endocrine cells with respect to themselves (A) or with respect to acinar cells (B). (C, D) Scatter plots showing location of cells within ROIs at the median of (A) and (B) distributions are plotted at (C) and (D), respectively. Cells are colored by AnnoSpat-predicted cell types. Endocrine cells tend to aggregate around themselves more often than with acinar cells. (E) The distributions with box-and-whisker plot overlays of the distance at the maximal point in the mark cross-correlation functions across control, AAb+, recent T1D, and prolonged T1D. AAb+ and recent T1D tend to have greater aggregation of islets with CD8+ T cells than control and prolonged T1D cohorts. (F-I) Scatter plots showing location of cells within ROIs at the median of each cohort in (E). From lowest to highest aggregation: prolonged T1D (F), control (G), AAb+ (H), and recent T1D (I). Cells are colored by AnnoSpat-predicted cell types. Box-and-whisker plots: center line, median; box limits, upper (75th) and lower (25th) percentiles; whiskers, 1.5 · interquartile range; points, outliers.
