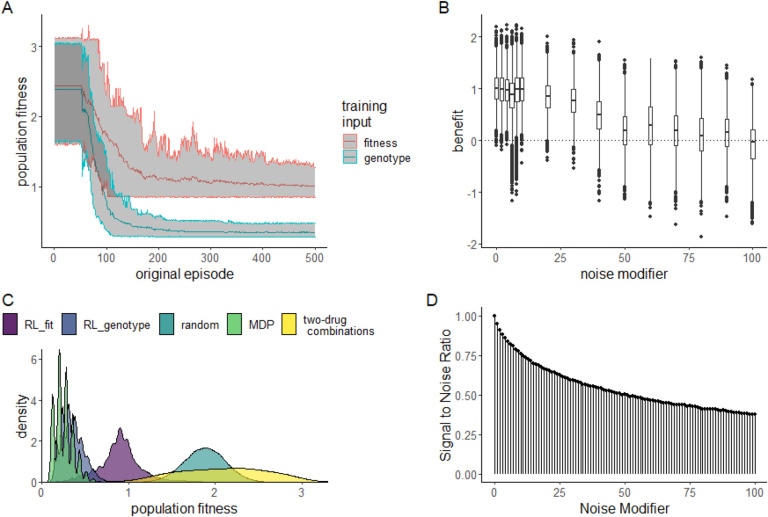
Figure 2. Performance of RL agents in a simulated E. coli system.
A: Line plot showing the effectiveness (as measured by average population fitness) of the average learned policy as training time increases on the x-axis for RL agents trained using fitness (red) or genotype (blue). B: Boxplot showing the effectiveness of 10 fully trained RL-fit replicates as a function of noise. Each data point corresponds to one of 500 episodes per replicate (5000 total episodes). The width of the distribution provides information about the episode by episode variability in RL-fit performance. C: Density plot summarizing the performance of the two experimental conditions (measured by average population fitness) relative to the three control conditions. D: Signal to noise ratio associated with different noise parameters. Increasing noise parameter decreases the fidelity of the signal that reaches the reinforcement learner.

