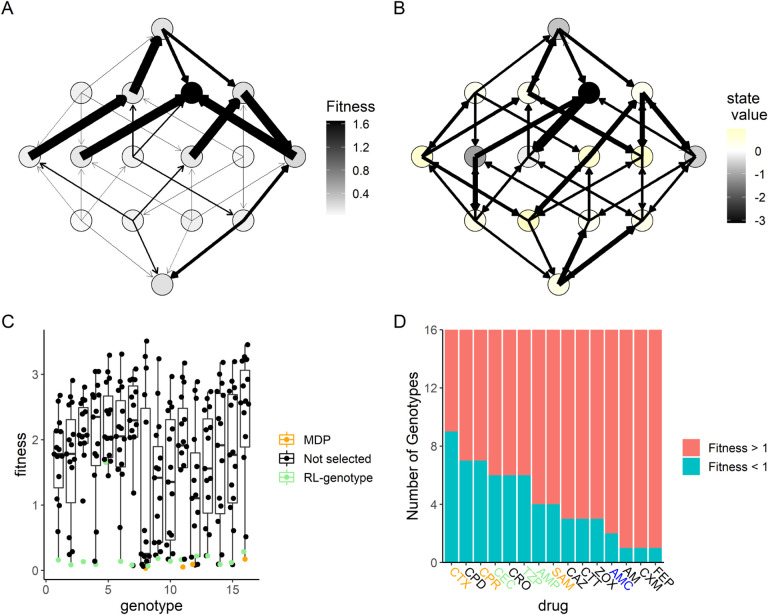
Figure 5. MDP value function closely matches opportunity landscape for drugs commonly used under MDP policy.
Panels A and B show the 16-genotype fitness landscape under study, starting with the wild type at the top, progressing throw the single mutants, double mutants, triple mutants, and finally the quadruple mutant at the bottom. A: Opportunity landscape for the 5 drugs most commonly used under the MDP policy (CTX, CPR, AMP, SAM, and TZP). B: Observed state transitions under the MDP policy. The node color corresponds to the value function estimated by solving the MDP. Lower values correspond to states the MDP policy attempts to avoid while higher values correspond to states the MDP policy attempts to steer the population. C: Scatter Plot showing the distribution of fitness with respect to genotype for the 15 β -lactam antibiotics under study. The drug selected by RL-genotype in a given genotype is highlighted in light blue. In cases where the MDP selected a different drug than RL-genotype, that drug is highlighted in orange. D: Number of genotypes with fitness above or below 1 for each drug under study. Drugs that are used by both the MDP and RL-genotype are highlighted in orange. Drugs that are used by only the MDP are highlighted in green. Drugs that are used by only RL-genotype are highlighted in blue.

