
Figure 1: Model version two performance and example image predictions.
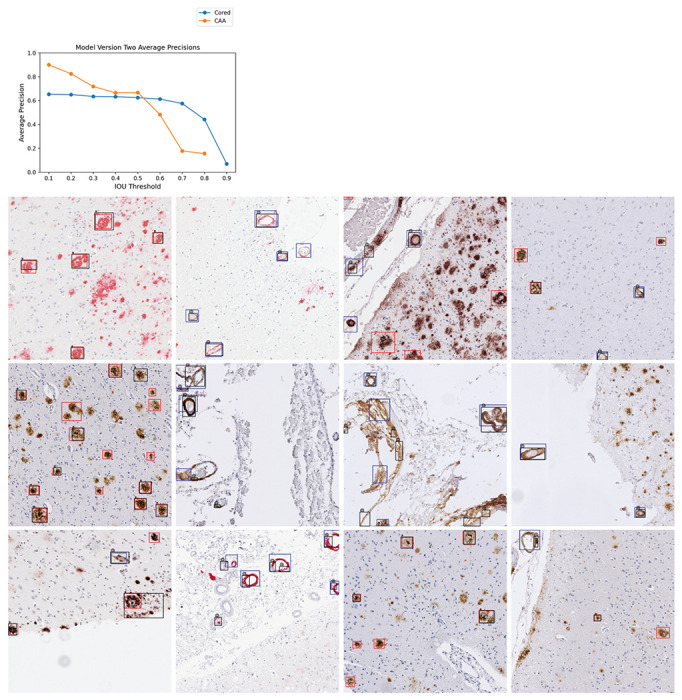
Top: Average precisions (AP) over the validation set at various IOU thresholds. The AP at IOU=0.90 is undefined for CAA. Bottom: 16 example images from the validation set. Cored prediction: red, cored label: black “*”; CAA prediction: blue, CAA label: black “@”. Note that these training label data are sparse and do not contain every pathology (Methods).