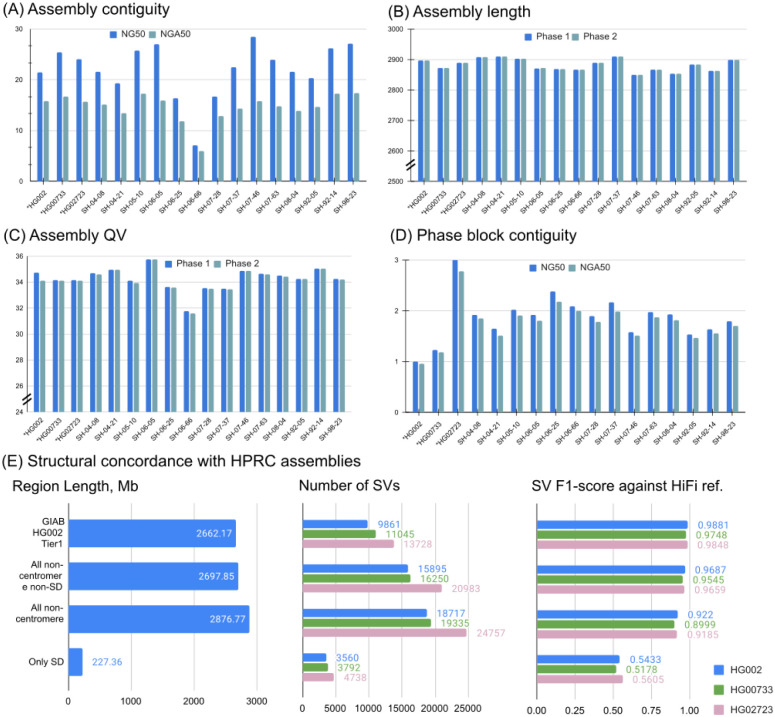
Figure 3. Assemblies of 14 brain tissues and 3 cell lines generated by Shasta+Hapdup.
(A) NG50 and NGA50 contiguity measured using QUAST. Sample 06_66 had the lowest contiguity due to the decreased sequencing yield. (B) Assembly length. (C) Mean assemblies QV computed using yak. (D) Contiguity of phased blocks, broken at phase switches. An increased value for HG02723 suggests an increased heterozygosity rate. (A-D) Cell lines marked with asterisks. (E) Structural variation call concordance with HiFi-based assemblies for various regions of the genome.

