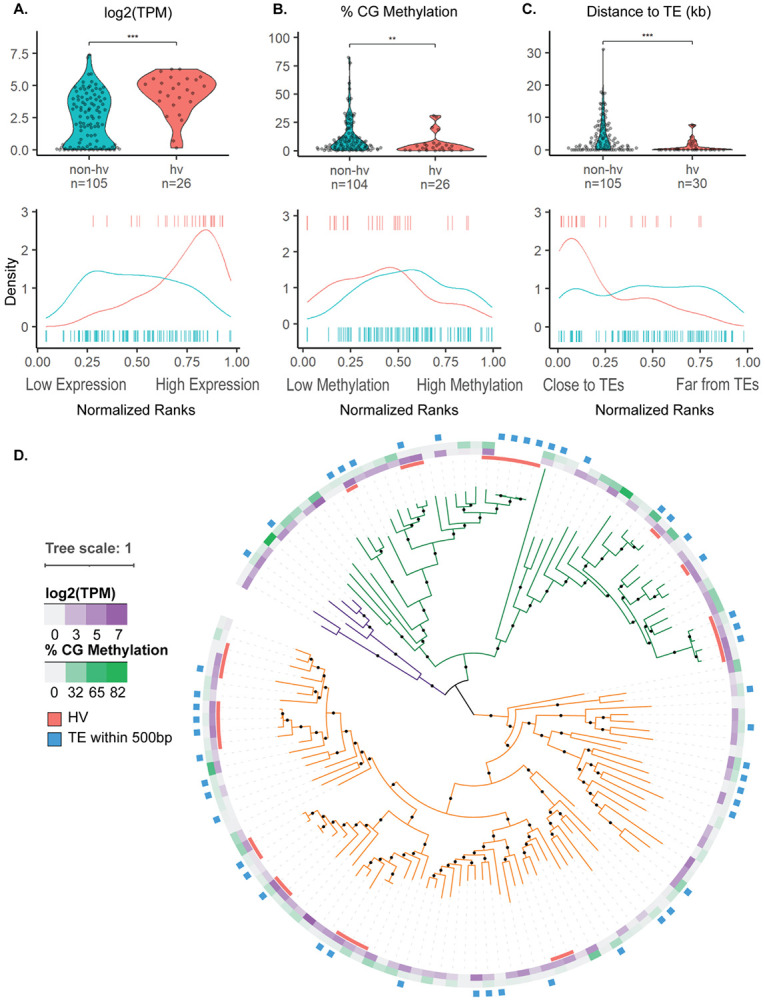
Figure 1:

Expression, methylation, and proximity to transposable elements distinguish hv and non-hv NLRs. A: average gene expression log2 (Transcripts per Million), B: average % CG methylation per gene, and C: distance to nearest transposable element (kbp) with normalized mean percentile rank density plots of hv and non-hvNLRs.* indicates a p-value between<0.05 and >= 0.01; ** indicates a p-value between 0<.01 and >=0.001; *** indicates a p-value <0.001. D: Features mapped onto a phylogeny of NLRs in A. thaliana Col-0. RNL, CNL, and TNL clades are colored in purple, green, and orange, respectively. NLRs without log2(TPM) or % CG methylation data were determined to be unmappable (see methods).
