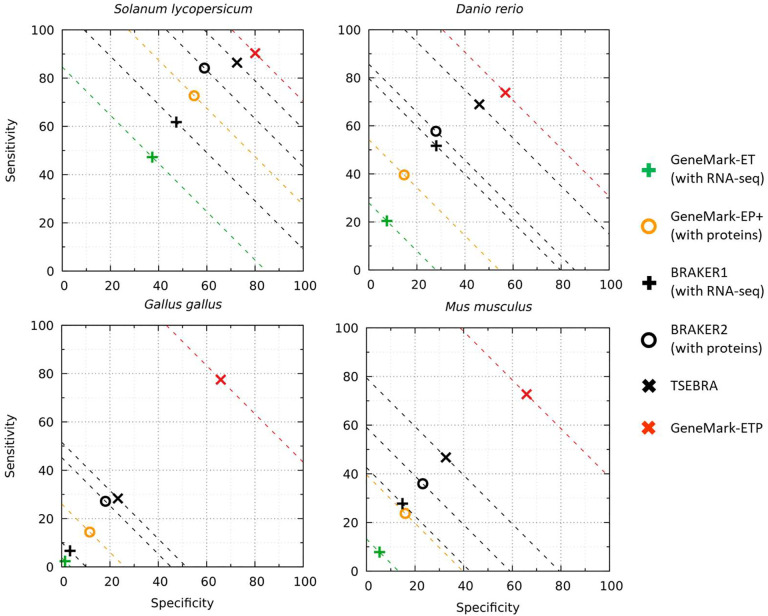
Figure 4.
Gene level Sn and Sp of gene predictions made by GeneMark-ETP and five other gene prediction tools in the four large genomes. The Sn and Sp values were defined with respect to selected subsets of genes from genome annotation (see text). In these genomes (with length > 300 Mb), GeneMark-ETP output did not include genes with no match to extrinsic support (see text). The ‘Order excluded’ protein databases were used.

