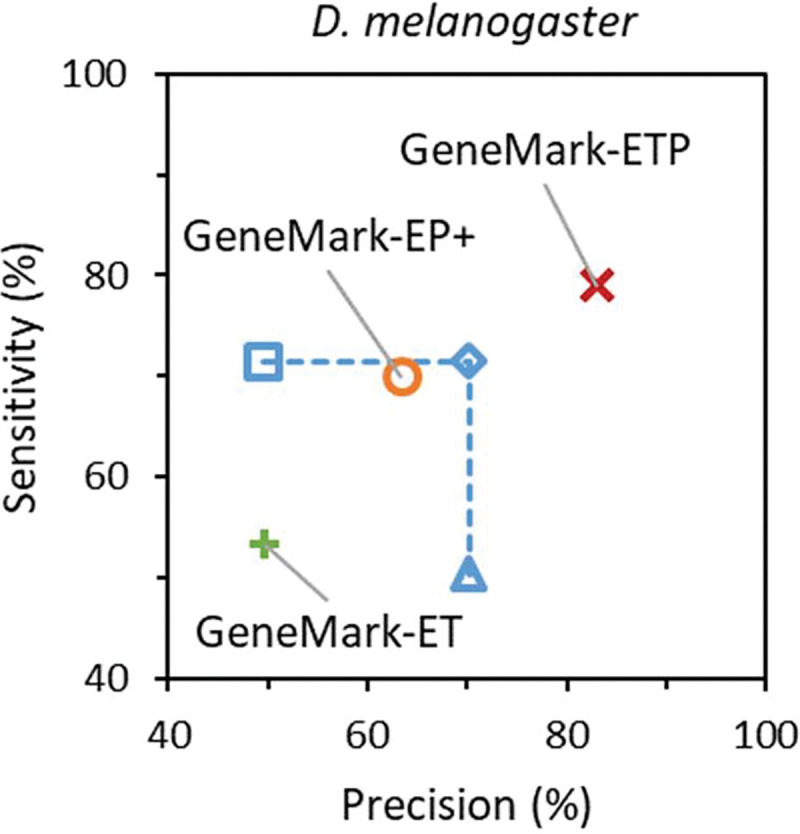
Figure 5.

Gene-level Sn and Pr of the gene predictions in the D. melanogaster genome. The gene predictions were generated by GeneMark-ET (green), GeneMark-EP+ (orange), and GeneMark-ETP (red). We also show the Sn and Pr values for the Union (square) and the Intersection (triangle) of the sets of GeneMark-ET and GeneMark-EP+ gene predictions and the ‘best combination’ of these two gene prediction sets (diamond). The true positives were defined with respect to the annotation of the D. melanogaster genome. The ‘Species excluded’ database was used for GeneMark-EP+ and GeneMark-ETP runs.
