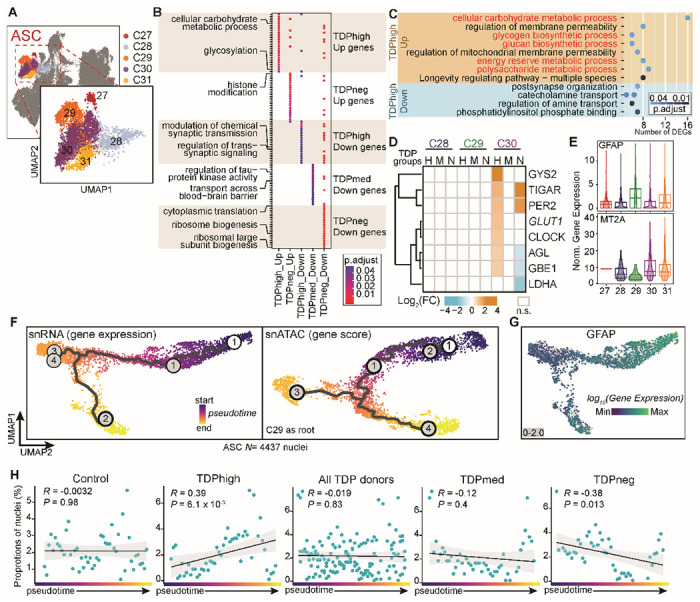
Fig. 5. pTDP-43 level specific dysregulation of astrocytes correlates with the pseudotime trajectory.

(A) UMAP plots of astrocyte (ASC) clusters. (B) DEG clusters enriched for specific pTDP-43 level groups in ASC subpopulations; distinct GO terms are marked for each DEG cluster. (C) Enriched ontology terms for DEGs in the TDPhigh donor group include glucose/glycogen metabolism and are highlighted in red. (D) Genes involved in glucose/glycogen metabolism and their fold change in different ASC subpopulations and pTDP-43 level groups. (E) Cluster ASC-C30 is distinct from other ASC subpopulations and it is defined by higher MT2A and lower GFAP. (F) Trajectory analysis: UMAP dimensionality reduction of astrocytes using snRNA-seq gene expression (left) and snATAC-seq gene score matrices (right). Each cell is colored by pseudotime trajectory assignment using ASC-C29 as the root node. (G) GFAP expression of the same trajectory UMAP as in F. (H) Scatterplot showing the proportion of ASC nuclei from C9orf72 ALS/FTD and control samples at 50 evenly sized bins across the trajectory. The black line shows a linear regression, and the gray outline represents the 95% confidence interval. Pearson correlation coefficient and P value from two-sided test are shown. Each panel represents the analysis of different C9orf72 donor groups.
