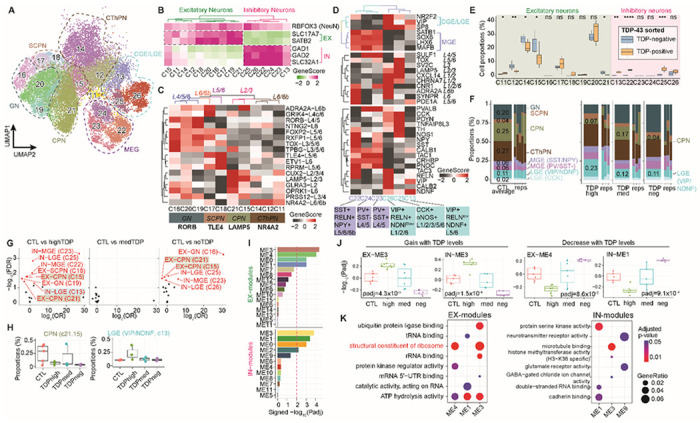
Fig. 6. Neuronal cell types in the prefrontal cortex of control and C9orf72 ALS/FTD donors.

(A) UMAP plots of neuronal clusters. (B) Gene activity scores for marker genes of excitatory and inhibitory neurons. (C) Heatmap of gene activity scores of cortical layer specific marker genes for excitatory neurons and axonal projection subclassification is indicated below. CPN, cortical projection neuron; GN, granule neuron; SCPN, subcortical projection neuron; CThPN, corticothalamic projection neuron. (D) Heatmap of gene activity scores of marker genes associated with inhibitory neurons of subpallial origin (top), cortical layers (middle) and subclassification (bottom). CGE, caudal ganglionic eminence; MGE, medial caudal ganglionic eminence; LGE, lateral ganglionic eminence; SST, somatostatin; RELN, reelin; NPY, neuropeptide Y; PV, parvalbumin; VIP, vasoactive intestinal peptide; NDNF, neuron-derived neurotrophic factor; CCK, cholecystokinin; nNOS, neuronal nitric oxide synthase. (E) Cell proportion deconvolution with pTDP-43 positive and negative nuclei (n.s. not statistically significant; P≤0.05 is considered statistically significant: * P≤0.05, ** P≤0.01, *** P≤0.001, **** P≤0.0001). (F) Proportion of neuronal subtypes defined by cortical projection or developmental origins in all sample groups. (G) Volcano plot showing odd ratio (OR) and FDR computed by MASC101 for all 16 neuronal clusters. Red labeled clusters are significantly increased or depleted in association with specific C9orf72 ALS/FTD donor groups (FDR-adjusted P < 0.05; absolute OR >0). (H) Proportion of nuclei in the significantly increased or depleted clusters found in panel G. (I) Significance of WGCNA modules with different levels of pTDP-43. (J) Pearson correlation of WGCNA module eigengenes and pTDP-43 levels that correspond to disease progression (dashed line, p-adj ≤0.01, statistically significant). Modules positively correlated (left) and negatively correlated (right) with disease progression. (K) Gene ontology analysis of the hub genes in each disease progression correlated module (same modules as shown in panels I and J).
