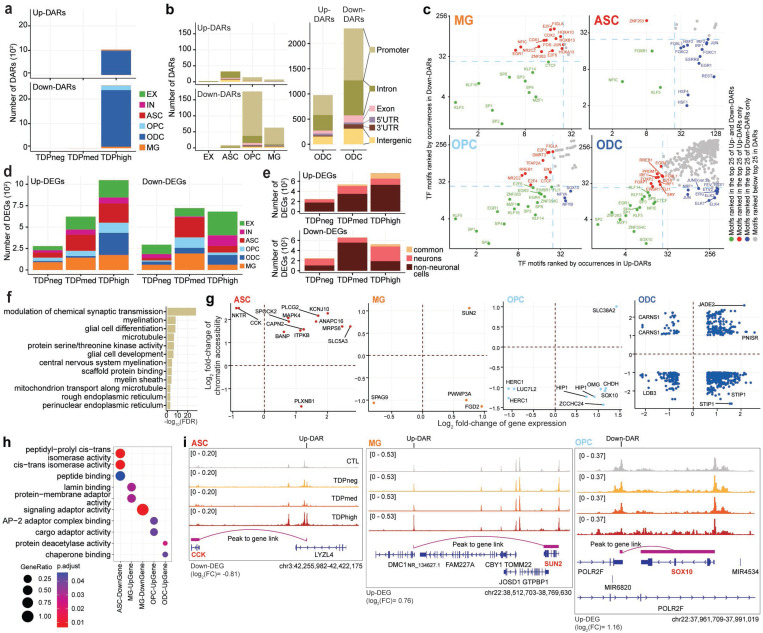
Fig. 2. Cell-type specific dysregulation of gene expression and chromatin accessibility in C9orf72 ALS/FTD donors.
(a) Total number of DARs categorized by cell type and pTDP-43 donor group. (b) Total number of DARs found in pTDPhigh donor group categorized by cell types by cell type (left) and distribution of DARs related to functional annotations in oligodendrocyte lineage cells (right). (c) Occurrence of Transcription Factor (TF) motifs in DARs in non-neuronal cells found in the pTDPhigh donor group ranked by the frequency of occurrence. The TF with motif occurrences ranked highest in both Up- and Down-DAR are highlighted in green in the bottom left quadrant of each panel. TFs with motif occurrences ranked highest only in Up-DARs are marked in red and displayed in the top left quadrant, while TFs with motif occurrences ranked highest only in Down-DARs are marked in blue and displayed in the bottom right quadrant (d) Number of DEGs categorized by cell type and pTDP-43 donor group. (e) Number of differentially expressed genes common among neuronal and non-neuronal cells for each pTDP-43 donor group. (f) Gene Ontology enrichment analysis of genes located near DARs found in the pTDPhigh donor group. (g) DEGs with a linked DAR in astrocytes, microglia and oligodendrocyte lineage cells. (h) Gene Ontology enrichment analysis of DEGs with linked DARs as shown in panel (g). (i) Genome track visualization of the CCK (chr3:42,255,982–42,422,175), SUN2 (chr22:38,512,703–38,769,630) and SOX10 (chr22:37,961,709–37,991,019) loci in astrocytes, microglia and oligodendrocyte precursor cells, respectively.

