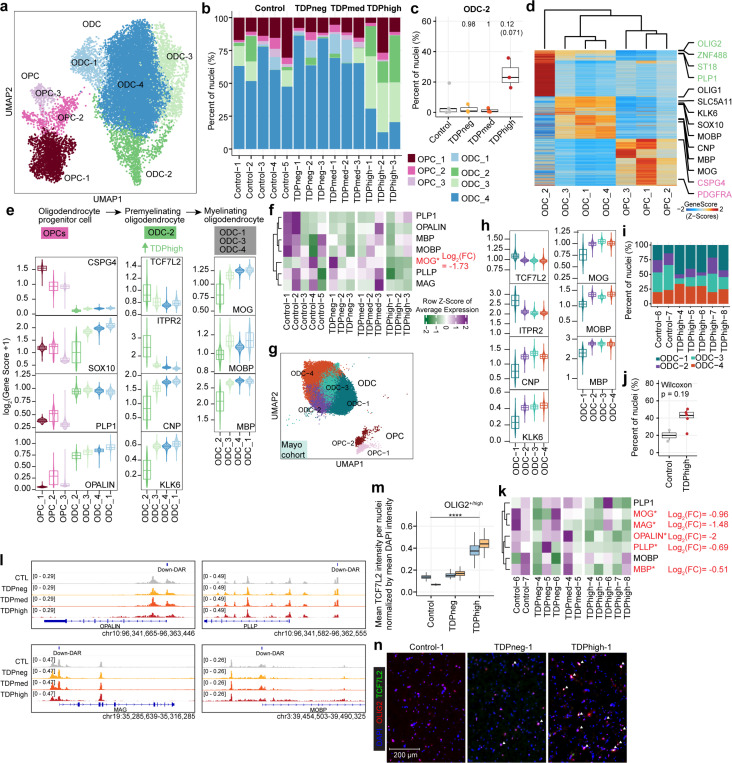
Fig. 3. Premature and premyelinating oligodendrocytes are unique to high pTDP-43 donors in late disease stages.
(a) UMAP plot of oligodendrocyte lineage cells for Emory samples. (b) Proportion of oligodendrocyte precursor cells (OPC) and oligodendrocytes (ODC) clusters in each sample, including donors with different levels of pTDP-43 and cognitively normal controls of the Emory cohort. (c) Proportion of ODC-C6 in different Emory cohort pTDP-43 donor groups (Kruskal–Wallis test with Benjamini–Hochberg correction (p-adj=0.0771) and without correction (p-value=0.0129). (d) Plot of snATAC-seq gene scores ordered by hierarchical clustering with marker genes distinguishing each ODC cell cluster for Emory cohort samples. (e) Illustration of developmental stages of oligodendrocyte lineage cells for Emory samples. Developmental stage specific genes and their gene scores are shown for each cluster (bottom), highlighting the unique characteristics of ODC-C6 with high expression of premyelinating oligodendrocyte genes. (f) Average expression of myelin associated genes in Emory samples. (g) UMAP plot of oligodendrocyte lineage cells for Mayo cohort samples. (h) ODC-1 in Mayo samples exhibit high expression of premyelinating oligodendrocyte genes, similar to ODC-2 in Emory samples. (i) Proportion of ODC-1 in Mayo control and TDPhigh samples (p-value=0.19, Wilcoxon Rank Sum). (j) Proportion of ODC clusters in Mayo cohort control and TDPhigh samples. (k) Average expression of myelin associated genes in Mayo samples. (l) IGV track view of changes in chromatin accessibility in close proximity to promoter regions of myelin associated genes. (m) Quantification mean TCF7L2 intensity per OLIG2-high nuclei normalized by mean DAPI intensity after nuclei segmentation. One-way ANOVA, ****p value < 0.0001.(n) Immunostaining of human postmortem cortical tissue for the oligodendrocyte lineage marker OLIG2 (red), premature oligodendrocyte marker TCF7L2 (green) and DAPI in blue. Overlapping OLIG2 and TCF7L2 staining were marked with white arrowhead.

