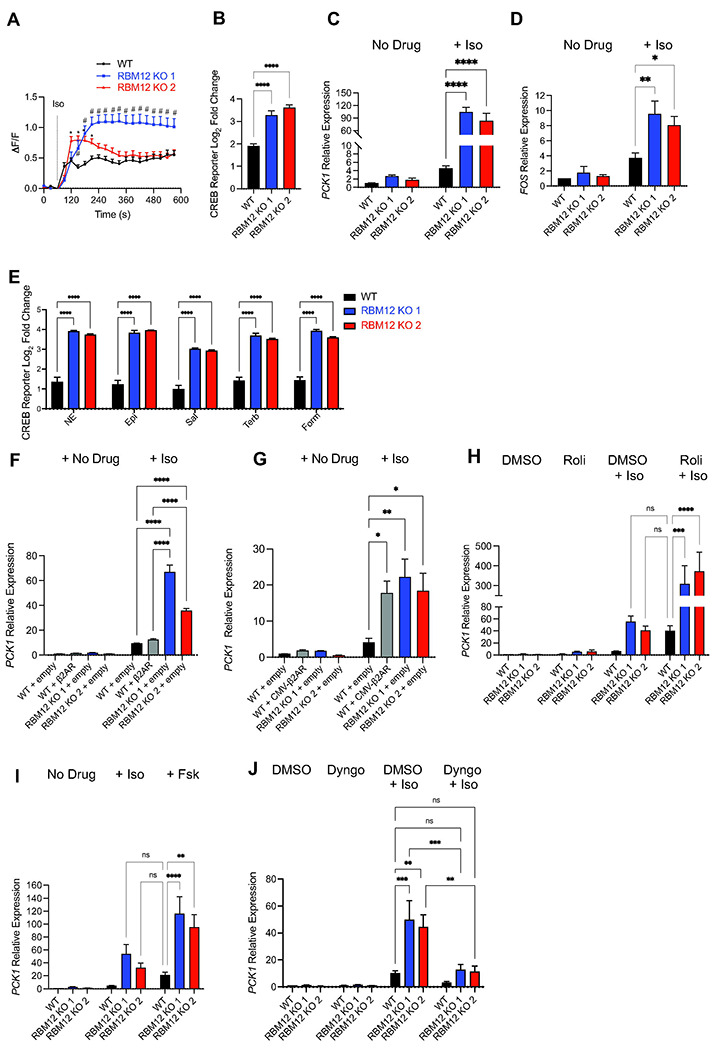
Figure 2. RBM12 loss leads to increased PKA activity and supraphysiological CREB-dependent transcriptional responses.

(A) PKA sensor (ExRai-AKAR2) activity in response to 10 nM Iso (n = 24-47 cells from 3-4 independent transfections per cell line). # and * denote statistically significant timepoints between RBM12 KO1 vs. wild-type (WT) and K02 vs. wild-type (WT), respectively. (B) Flow cytometry measurement of fluorescent CREB transcriptional reporter (CRE-DD-zsGreen) in response to 1 μM Iso and 1 μM Shield, 4 hours (n = 17). (C) RT-qPCR analysis of the endogenous β2-AR transcriptional target mRNAs, PCK1 (n = 15) and (D) FOS (n = 9) in untreated cells or in cells treated with 1 μM Iso for 1 hour. (E) Flow cytometry measurement of the fluorescent CREB transcriptional reporter (CRE-DD-zsGreen) in response to a panel of endogenous (10 μM norepinephrine/NE, 10 μM epinephrine/Epi) or synthetic (10 μM salbutamol/Sal, 10 μM terbutaline/Terb, 50 nM formoterol/Form) β2-M agonists and 1 μM Shield for 4 hours (n = 5). (F-G) PCK1 mRNA expression in untreated or 1 μM Iso-treated cells transfected with empty plasmid (n = 3), (F) plasmid construct expressing lower levels of β2AR (n = 3), or (G) plasmid expressing β2AR from a CMV promoter (n = 3). (H) PCK1 mRNA expression in untreated or 1 μM Iso-treated cells for 1 hour in the presence of either vehicle (DMSO) or 10 μM of the PDE4 inhibitor Rolipram (n = 4-5). (I) RT-qPCR of PCK1 mRNA in untreated cells or cells treated with 1 μM Iso-treated cells or 10 μM forskolin for 1 hour (n = 12-13). (J) PCK1 mRNA expression in cells pretreated with either vehicle (DMSO) or 30 μM Dyngo-4A for 20 min, then treated with 1 μM Iso for 1 hour (n = 5). All data are mean ± SEM. Statistical significance was determined using multiple unpaired t-tests with Benjamini, Krieger and Yekutieli false discovery rate correction (A), one-way ANOVA with Dunnett’s correction (B) or two-way ANOVA with Tukey’s correction (C-J). See also Figure S2.
